The concept of geospatial analytics is central to Geographic Information Systems(GIS) and is assimilated with generating new data/information and usually results in new data layers. While traditional GIS are well equipped to handle these types of operations, conducting spatial analytics in a web environment is much more complicated due to limitations in terms of bandwidth, memory, network connecticity, etc.
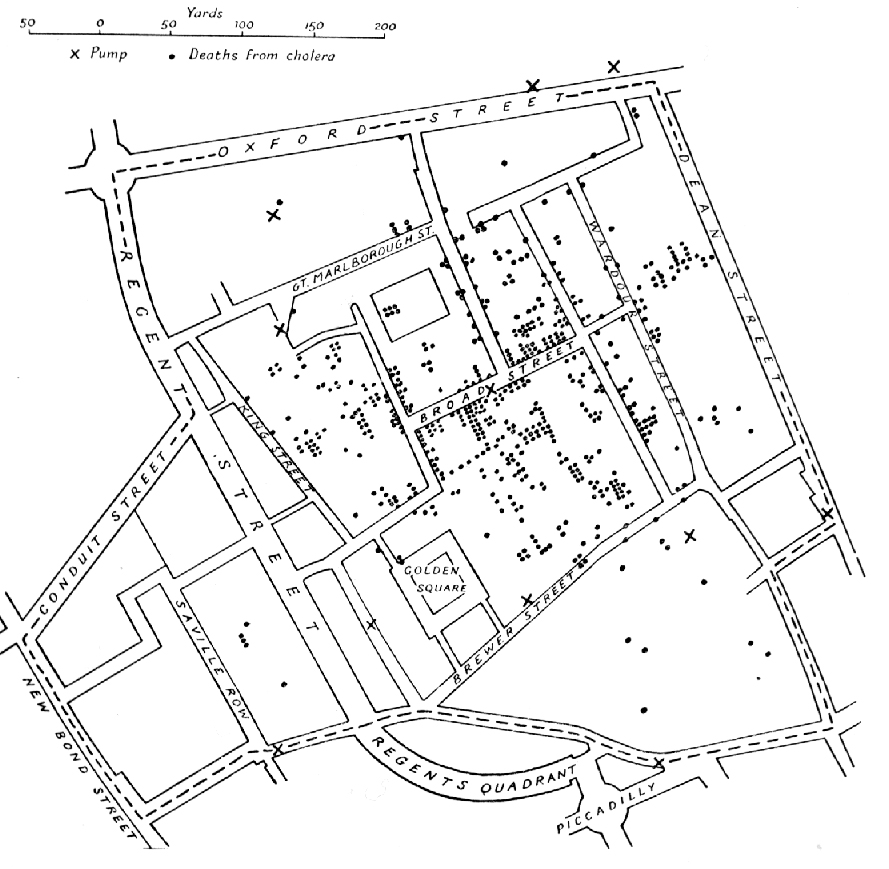
Figure 1: Map by Dr. John Snow of London, showing clusters of cholera cases in the 1854 Broad Street cholera outbreak. This was one of the first uses of map-based spatial analysis. source: Wikipedia
The geospatial domain features three main types or categories of analytics that build on the main geospatial data types.
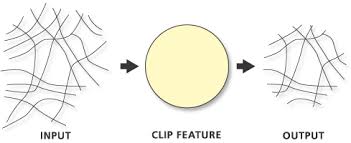
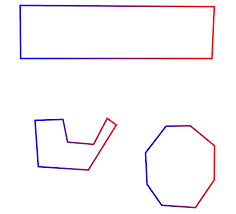
The first category consists of analytics performed exclusively on vector layers. The results of such operations are usually new vector layers or tables. These types of operations employ very often computatinal geometry methods and can be demanding in terms of resources.
Figure 2: Example of vector clip/overlay operation where roads are clipped with a circle
--
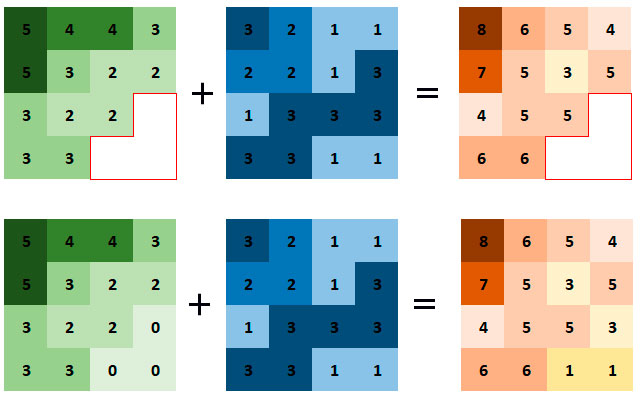
The second category or type operates on raster or imagery data, tend to be simpler and employ concepts defined in mathematical algebra. However, is is possible to build complex operations representing specific geospatial models/concepts by chaining simple map algebra expressions.
Figure 3: Example of raster algebra addition including NODATA
--
The third category is represented by mixed raster-vector analytics where computational logic is applied to a raster and a vector layer. These types of operations are complex and require supplementary operations like converting the vector layer to raster format or reprojection to a comon coordinate system.
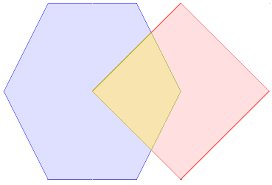
We have to outline that, in general any type of spatial operations between two distinct layers require the layers to share the same space in terms of coodinates and at least partially overlap like in the graphic below.
Figure 5: Example of intersecting geometries/layers
In the case the layers spatial coverages do not overlap no spatial operations are possible except merging them into one layer or checking if they overlap.