Hands-on exercise
Visualizing raster and vector datasets to save and share with other users.
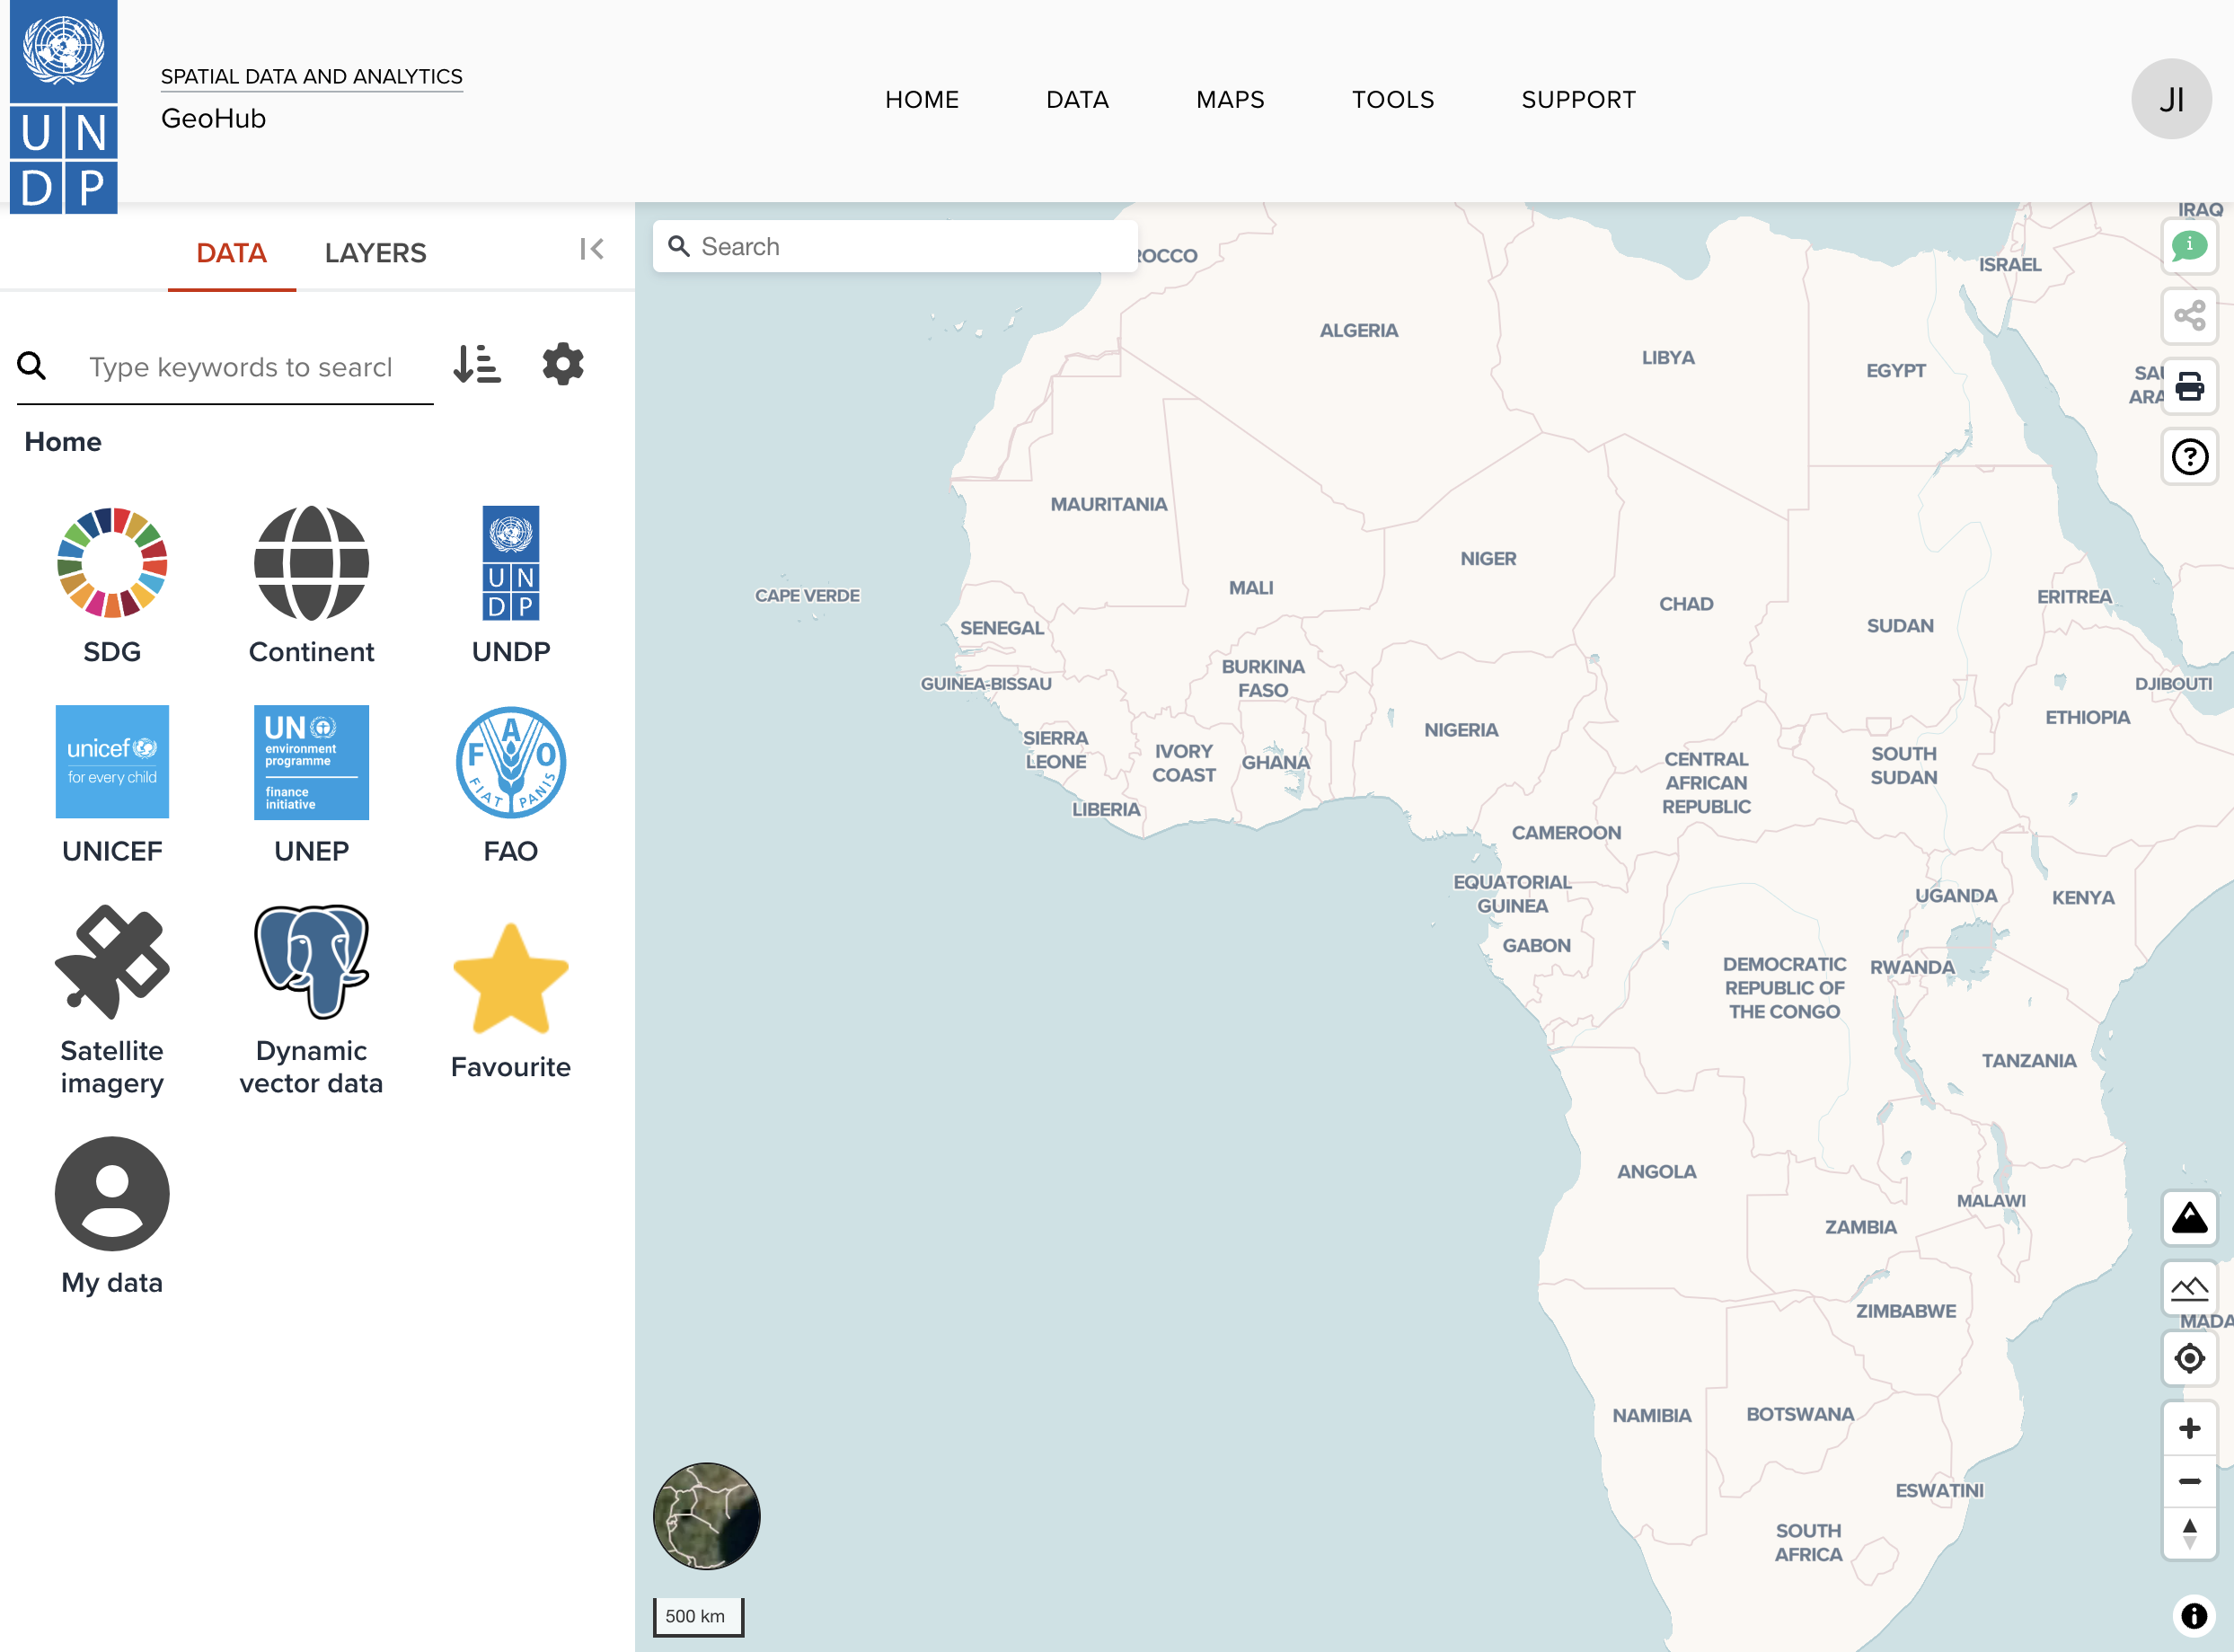
Open a blank map page
To create your own map to visualize, open a new blank map editor in GeoHub from here.
See the steps at Open a map editor
Add datasets to map
Add a raster dataset
Then, search a dataset named GHSL residential population estimates in 2030 under Data tab.
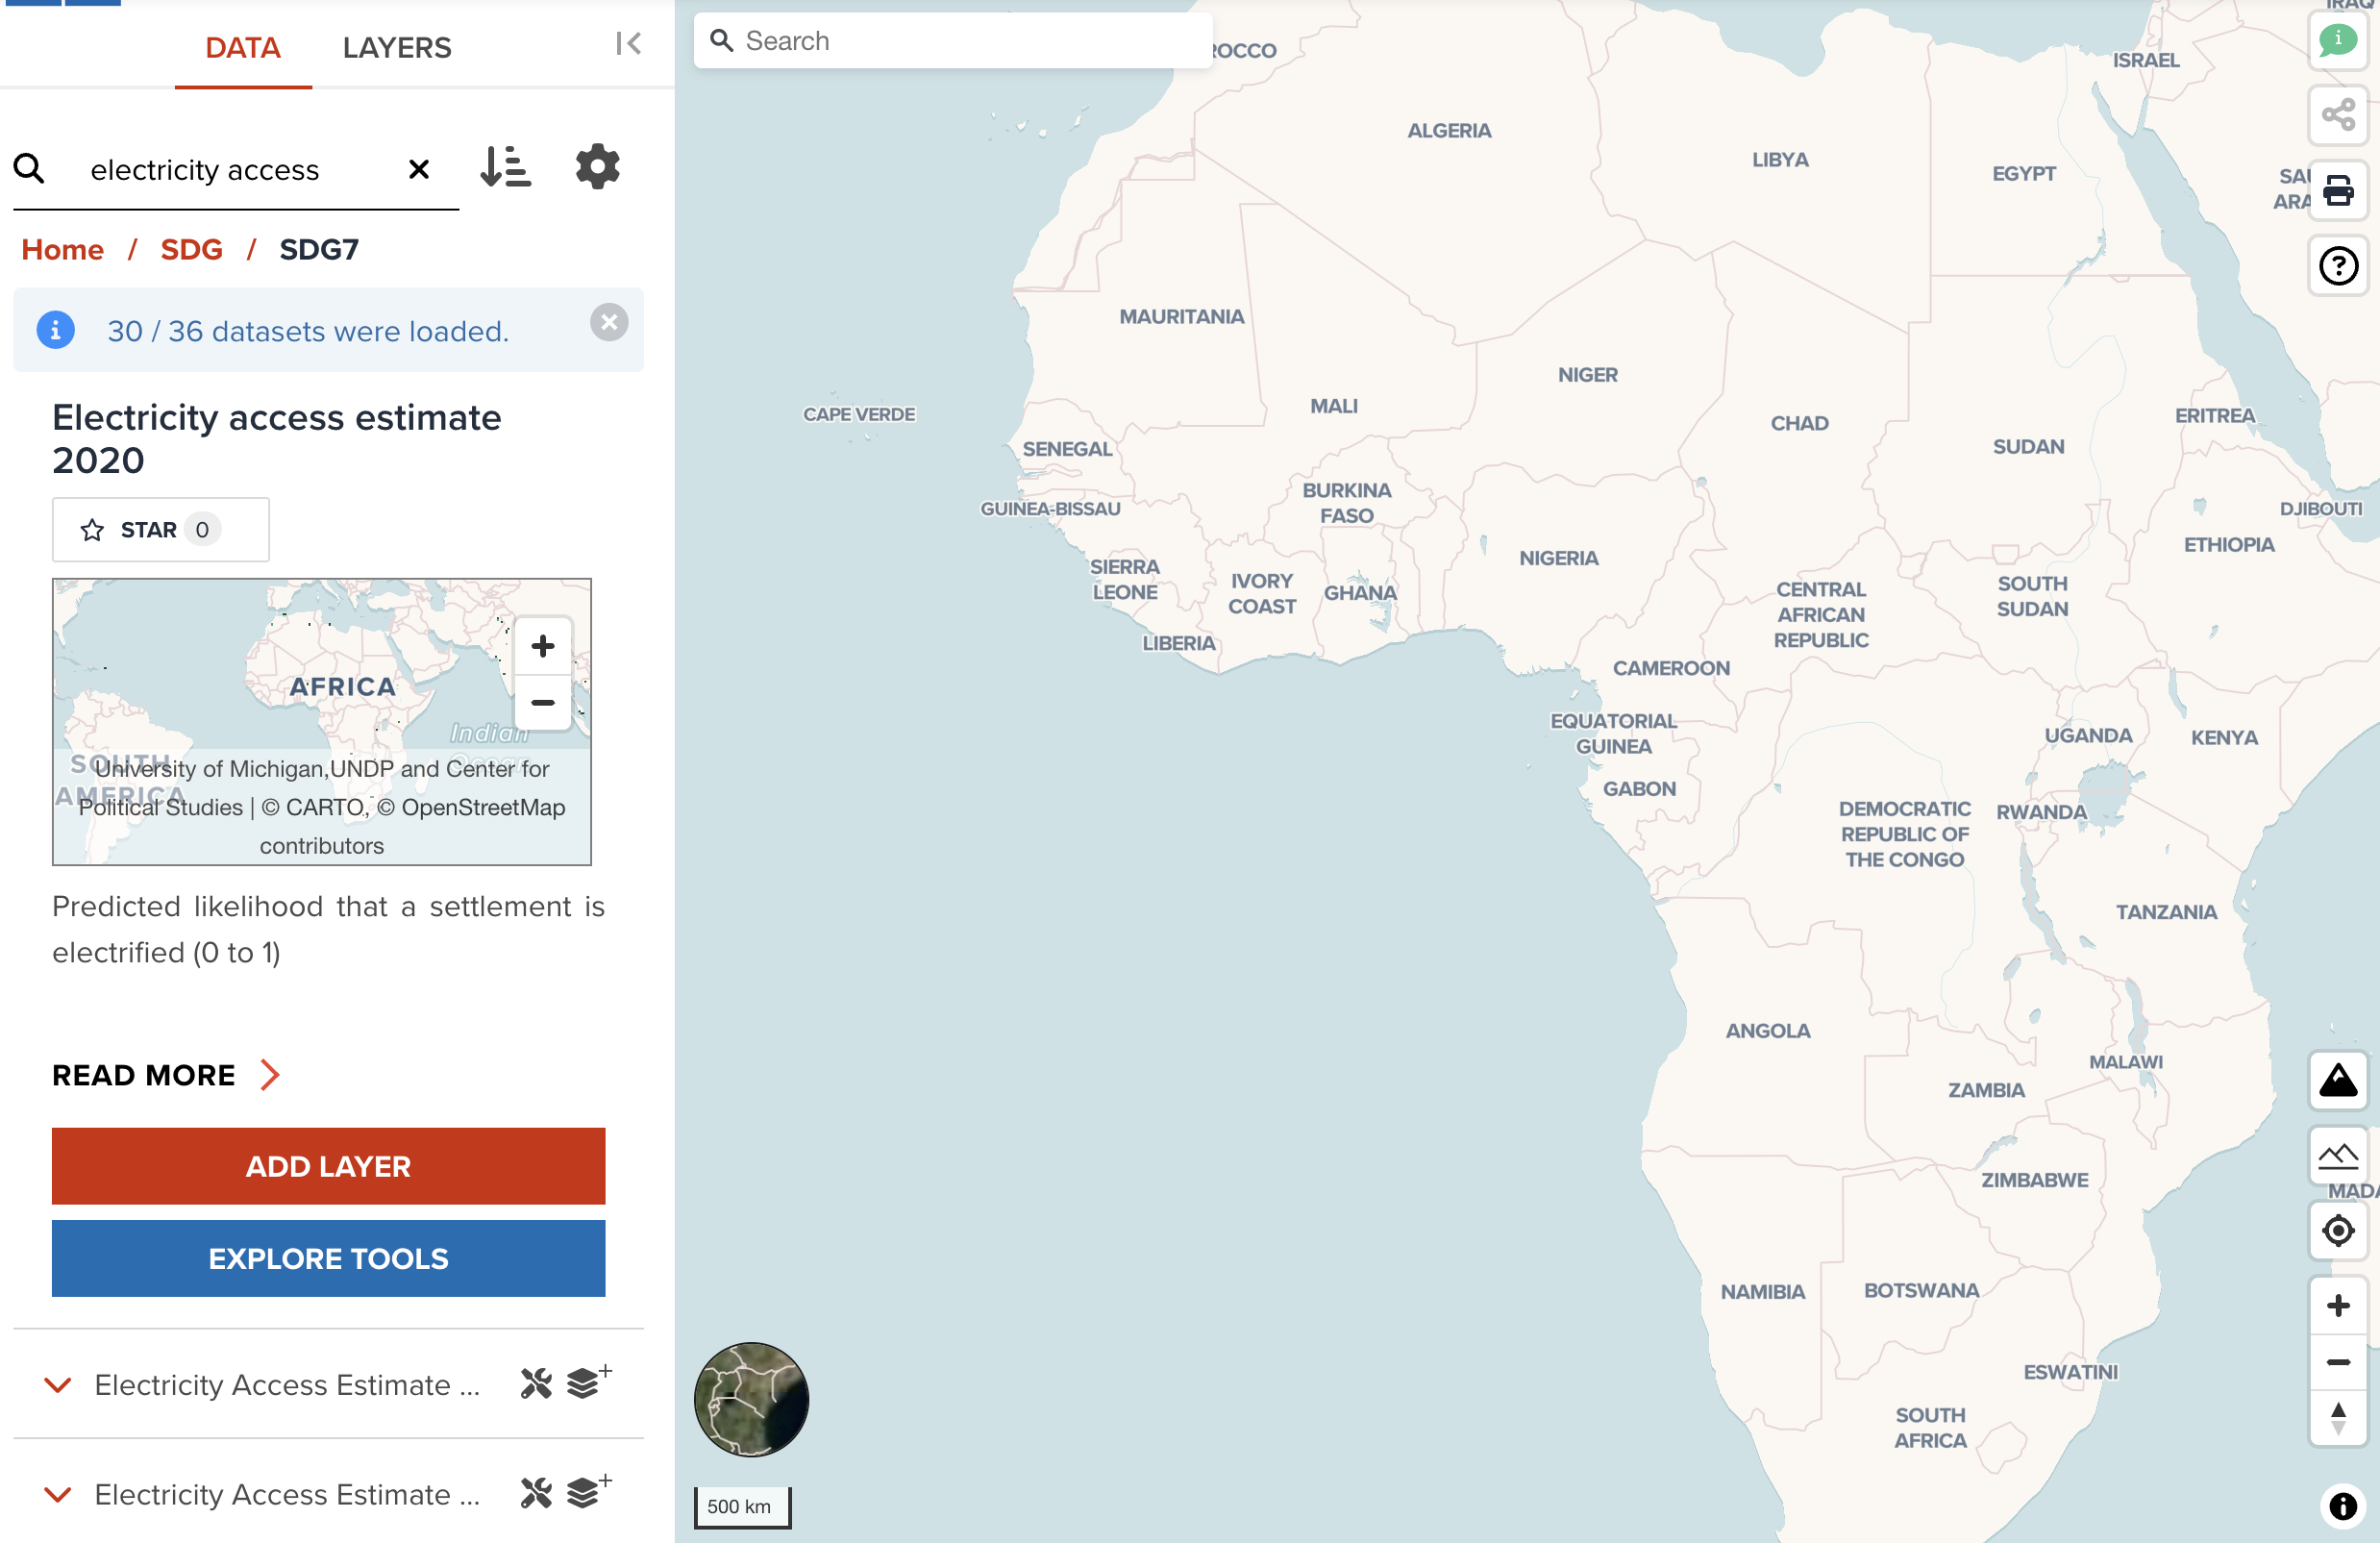
--
Once you found the dataset, click ADD LAYER button to add it to map. It will be shown under LAYERS tab.
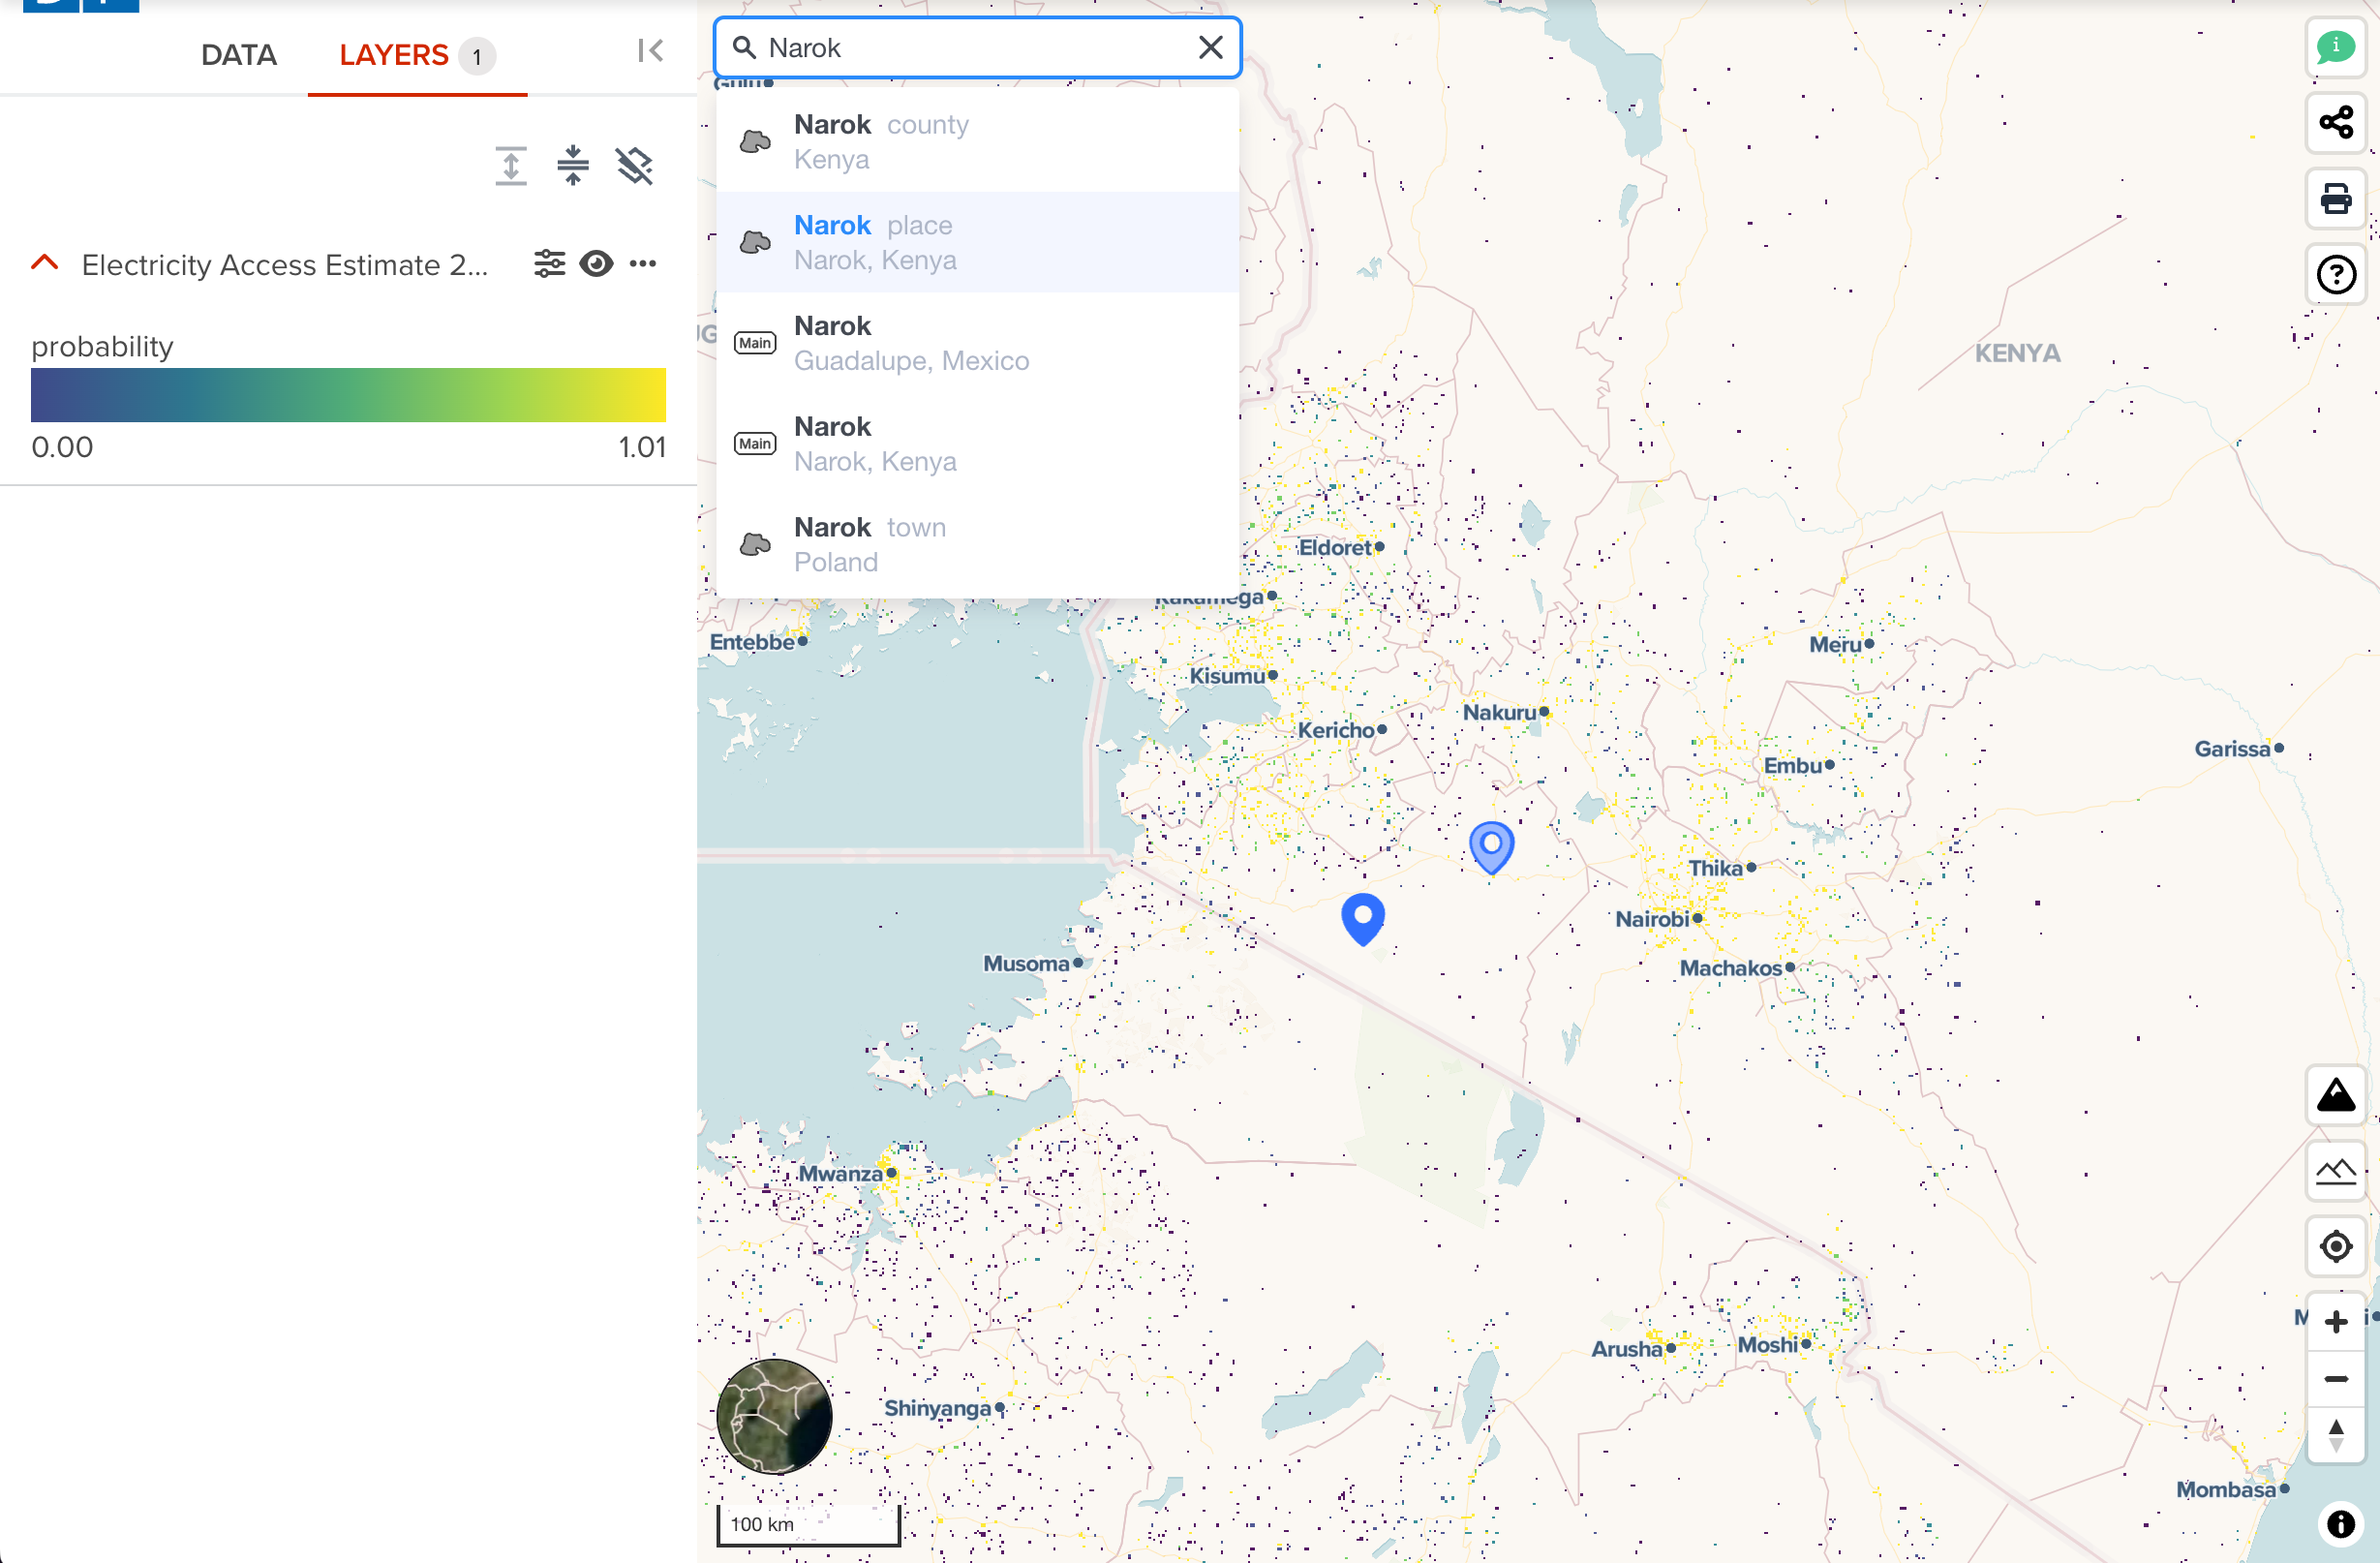
There is a geolocation search tool at the top-left of the map. Search your interested place and zoom it. Here, I search Zanzibar, Tanzania for my map.
--
--
This is a raster dataset,
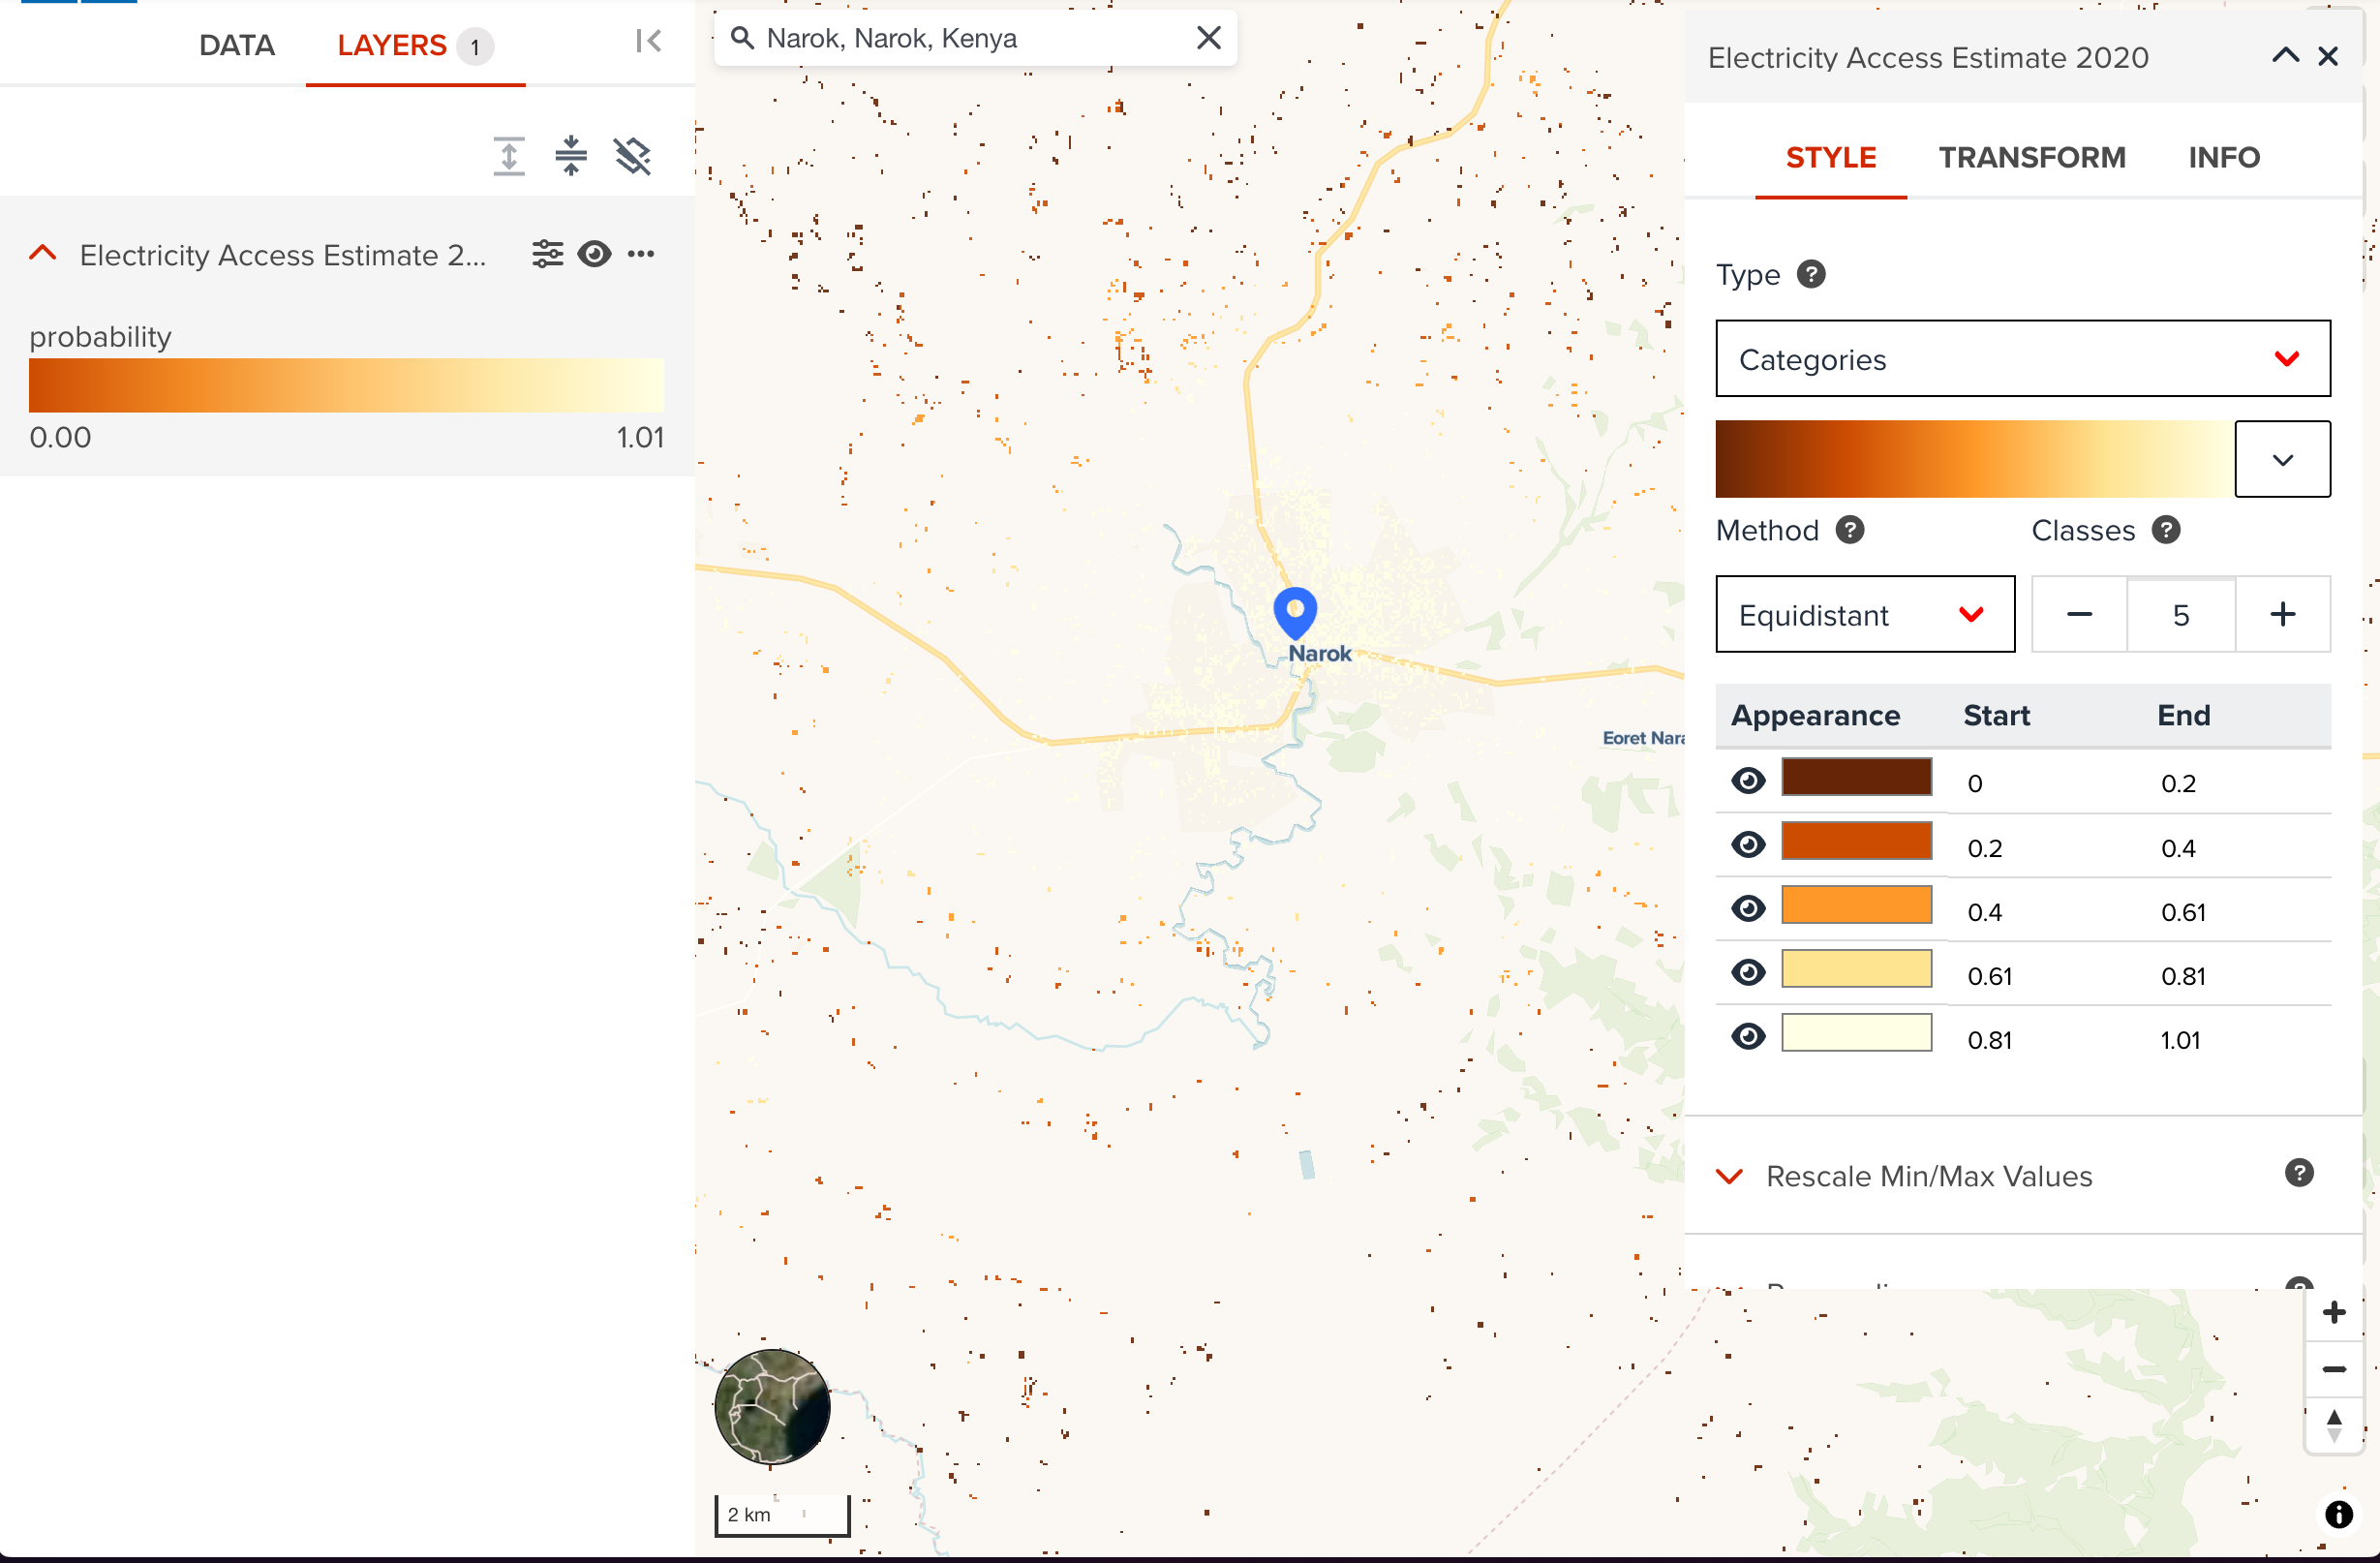
--
As default, GeoHub tries to optimise visualization for highly skewed dataset by rescaling minimum and maximum values. This dataset seems visualizing well at Zanzibar area. However, you may need to change raster rescale values if the visualization is not what you desire.
--
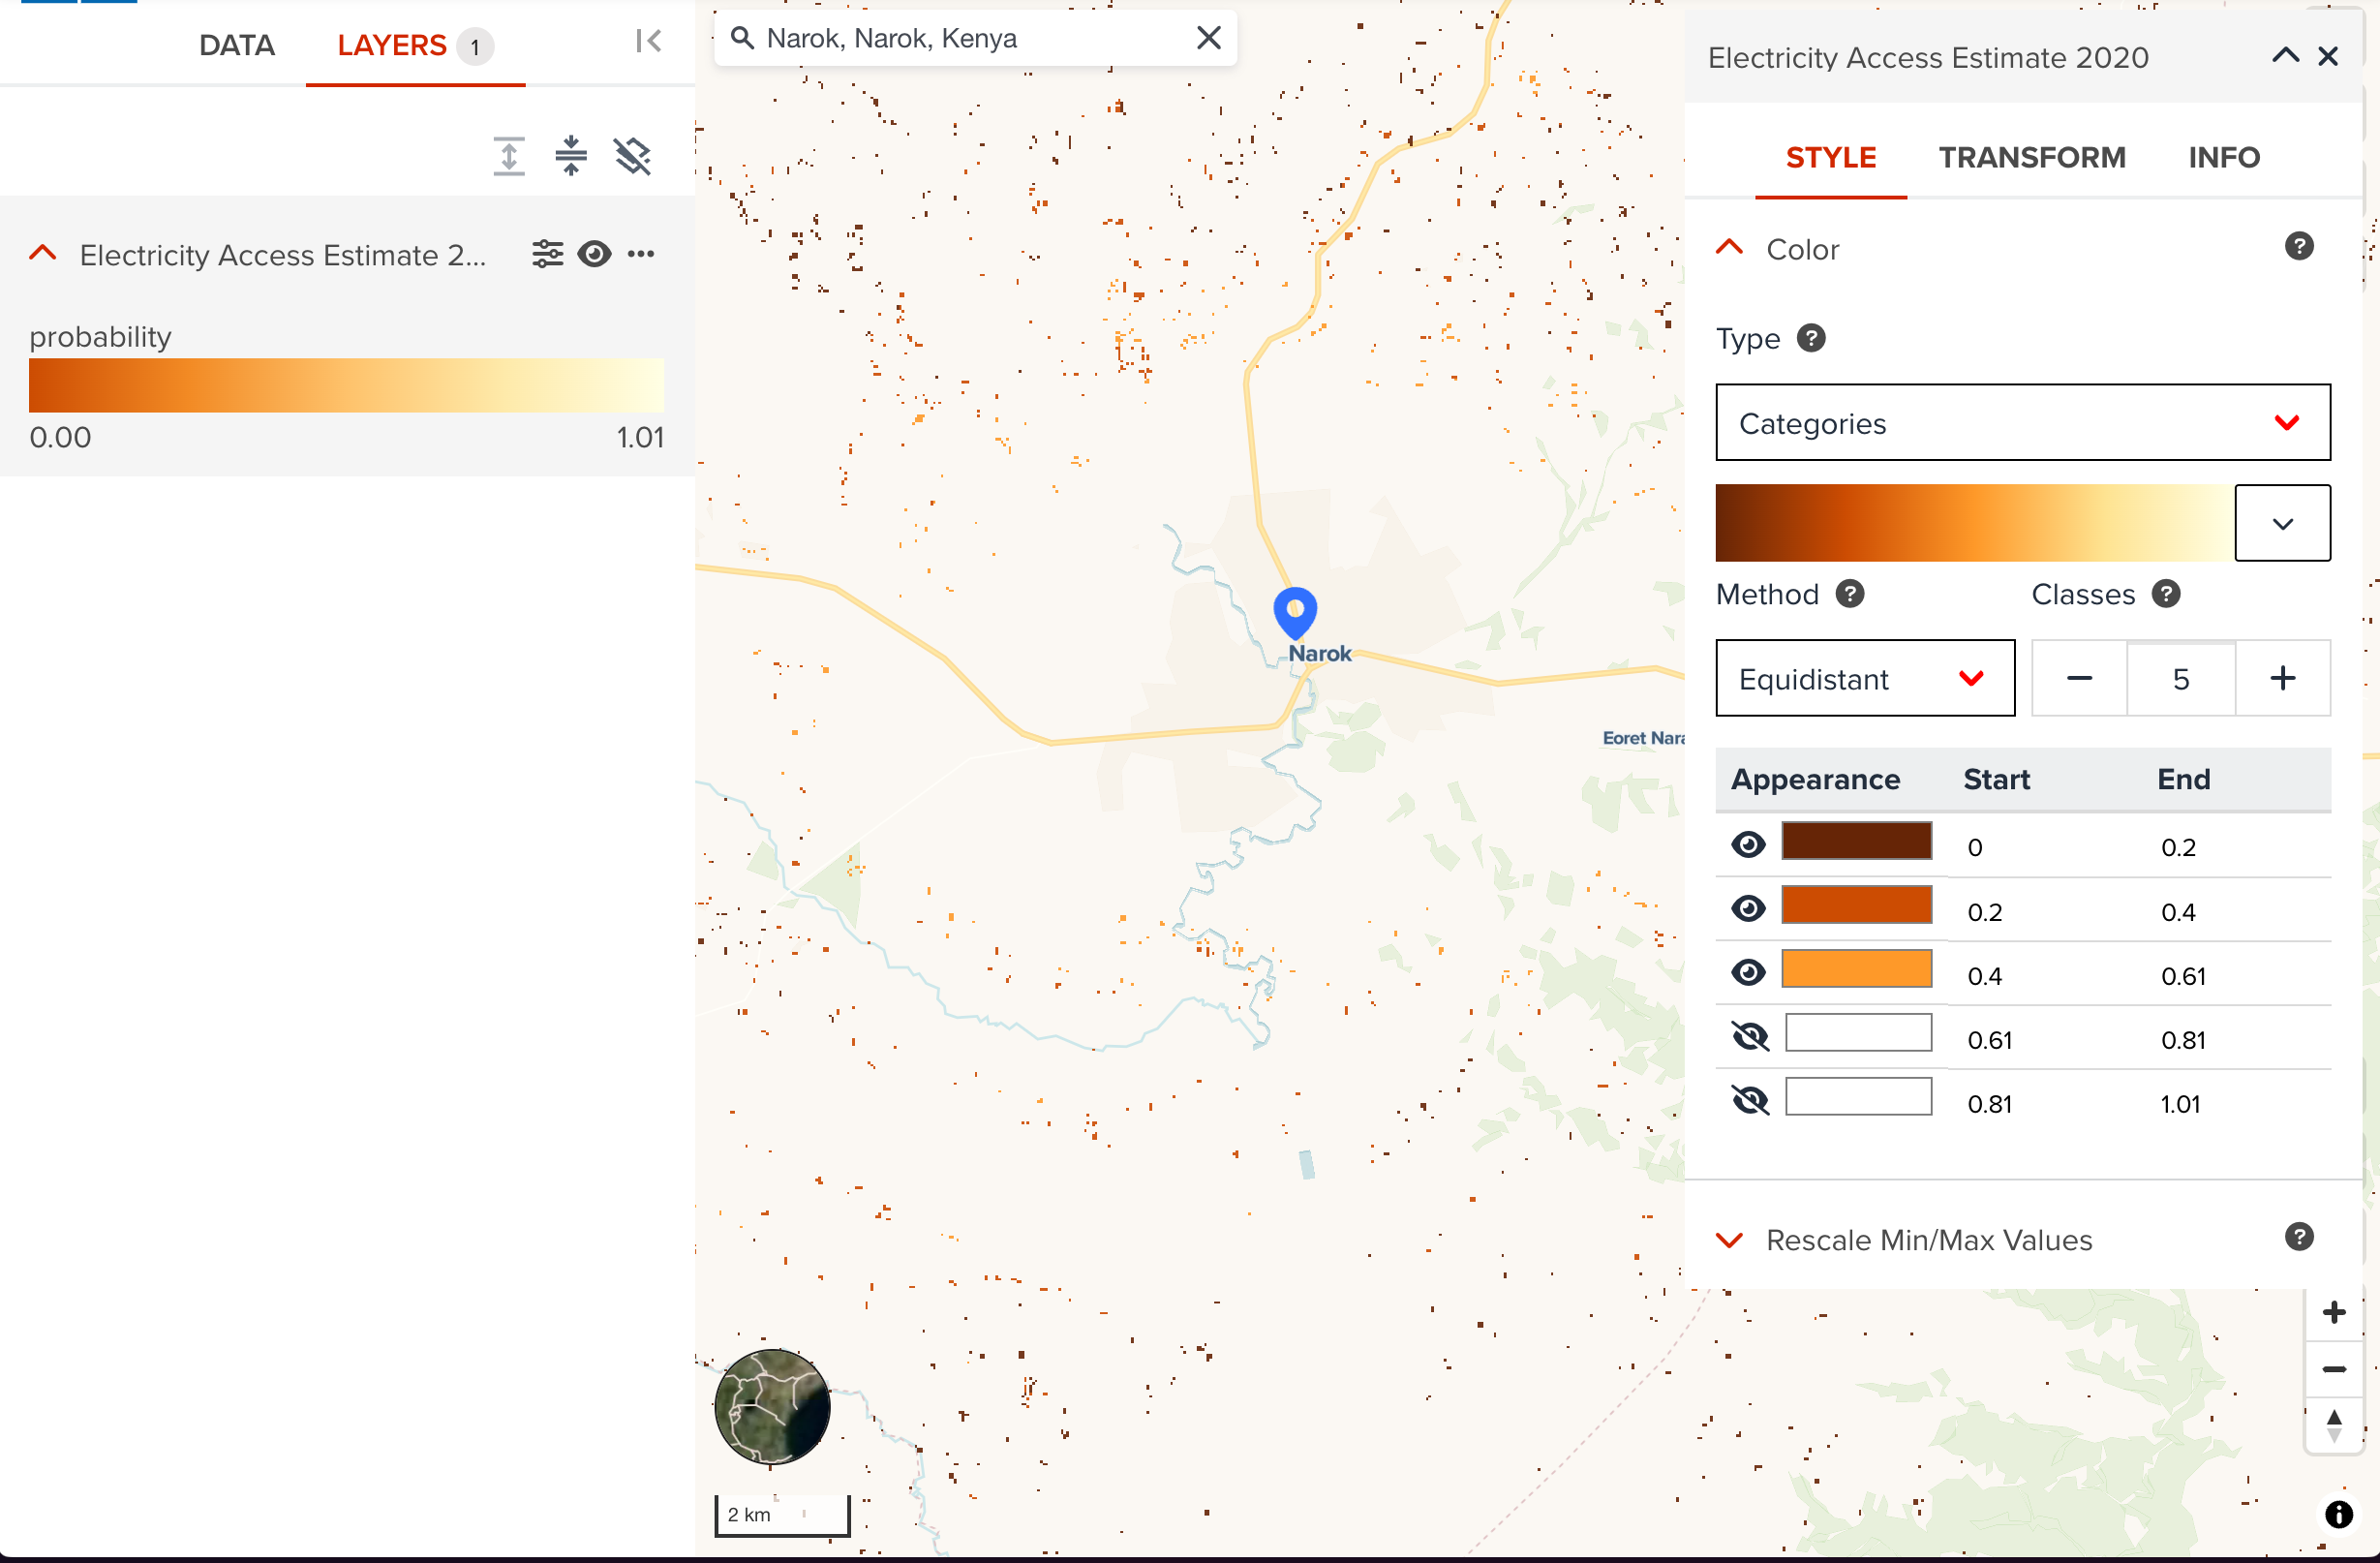
You can close editing panel for this layer now.
Add a vector dataset
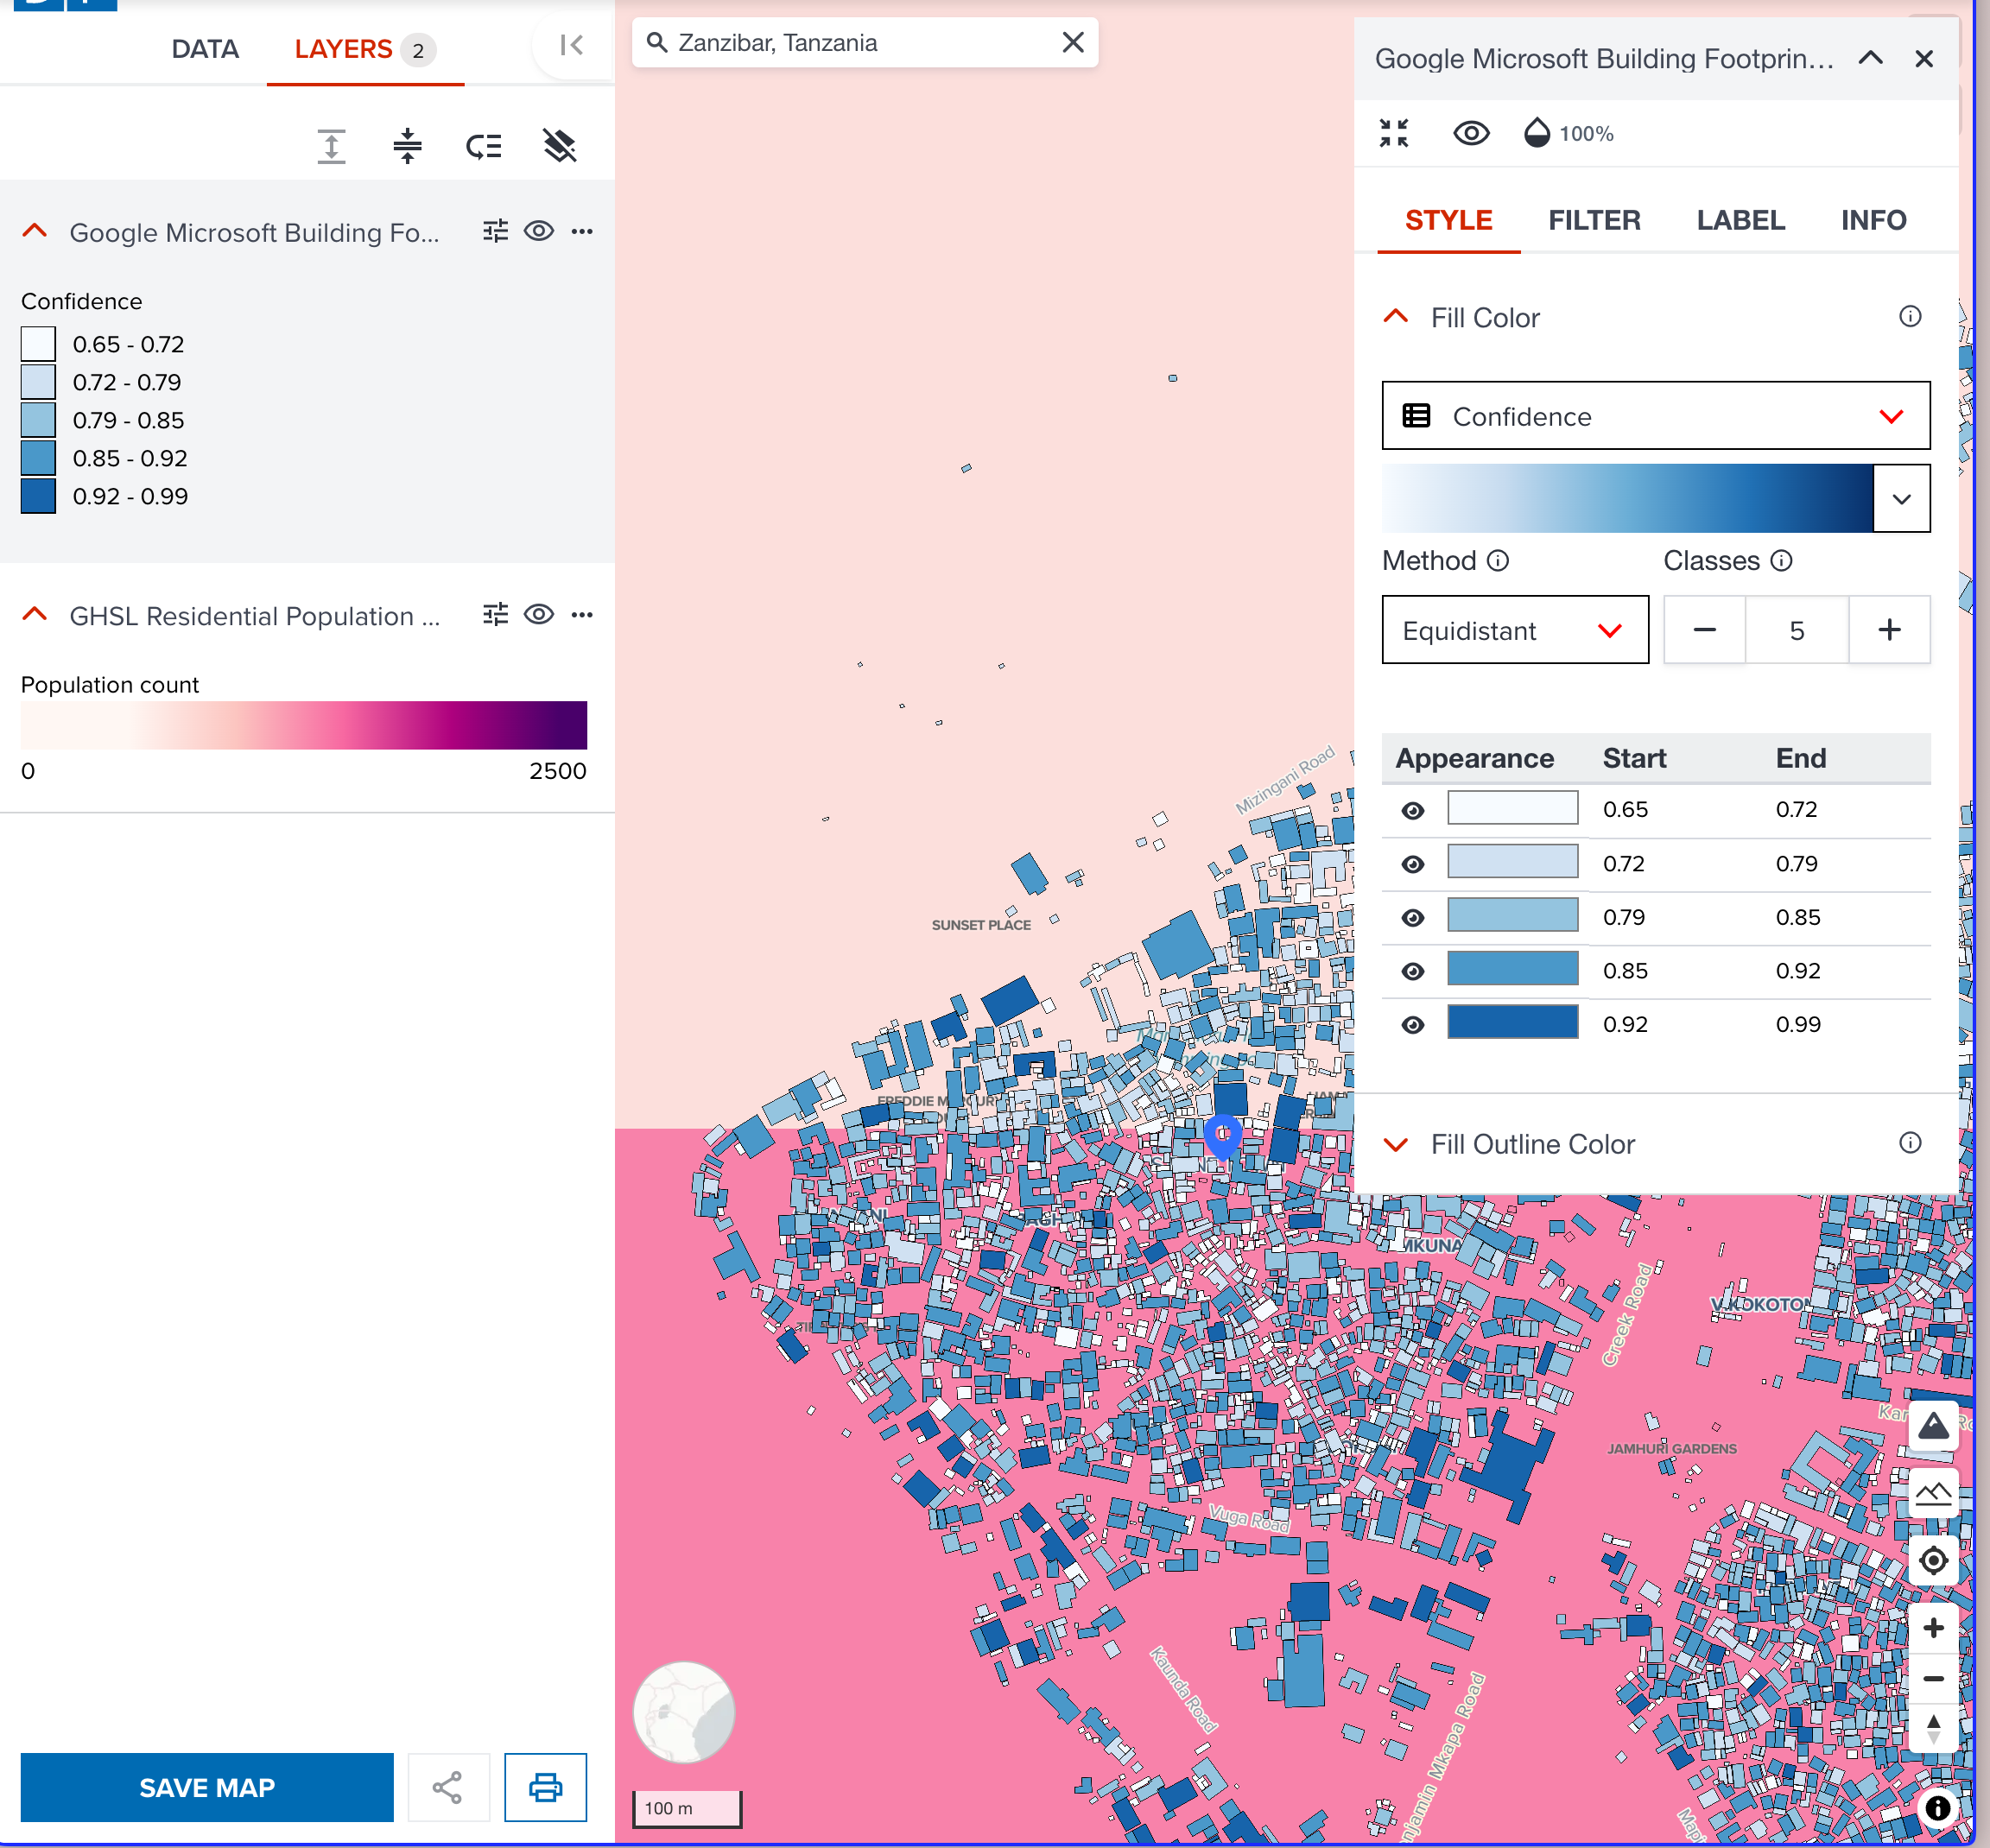
In the next, we are going to add a polygon layer from Microsoft/Google Open building. Go to DATA tab in side bar, search Google Microsoft Building Footprints as of September 2023 dataset.
--
Click Add layer to add this dataset to the map. Here, I select Polygon as a layer type for making 2D map. After adding it, map scale was changed to global again because it is global dataset. Zooming to Zanzibar again.
--
Let's change a little bit visualization for building data. Open building data has a field called confidence how AI was confident to generate this building data.
--
Change color to categorised, and select Confidence field.
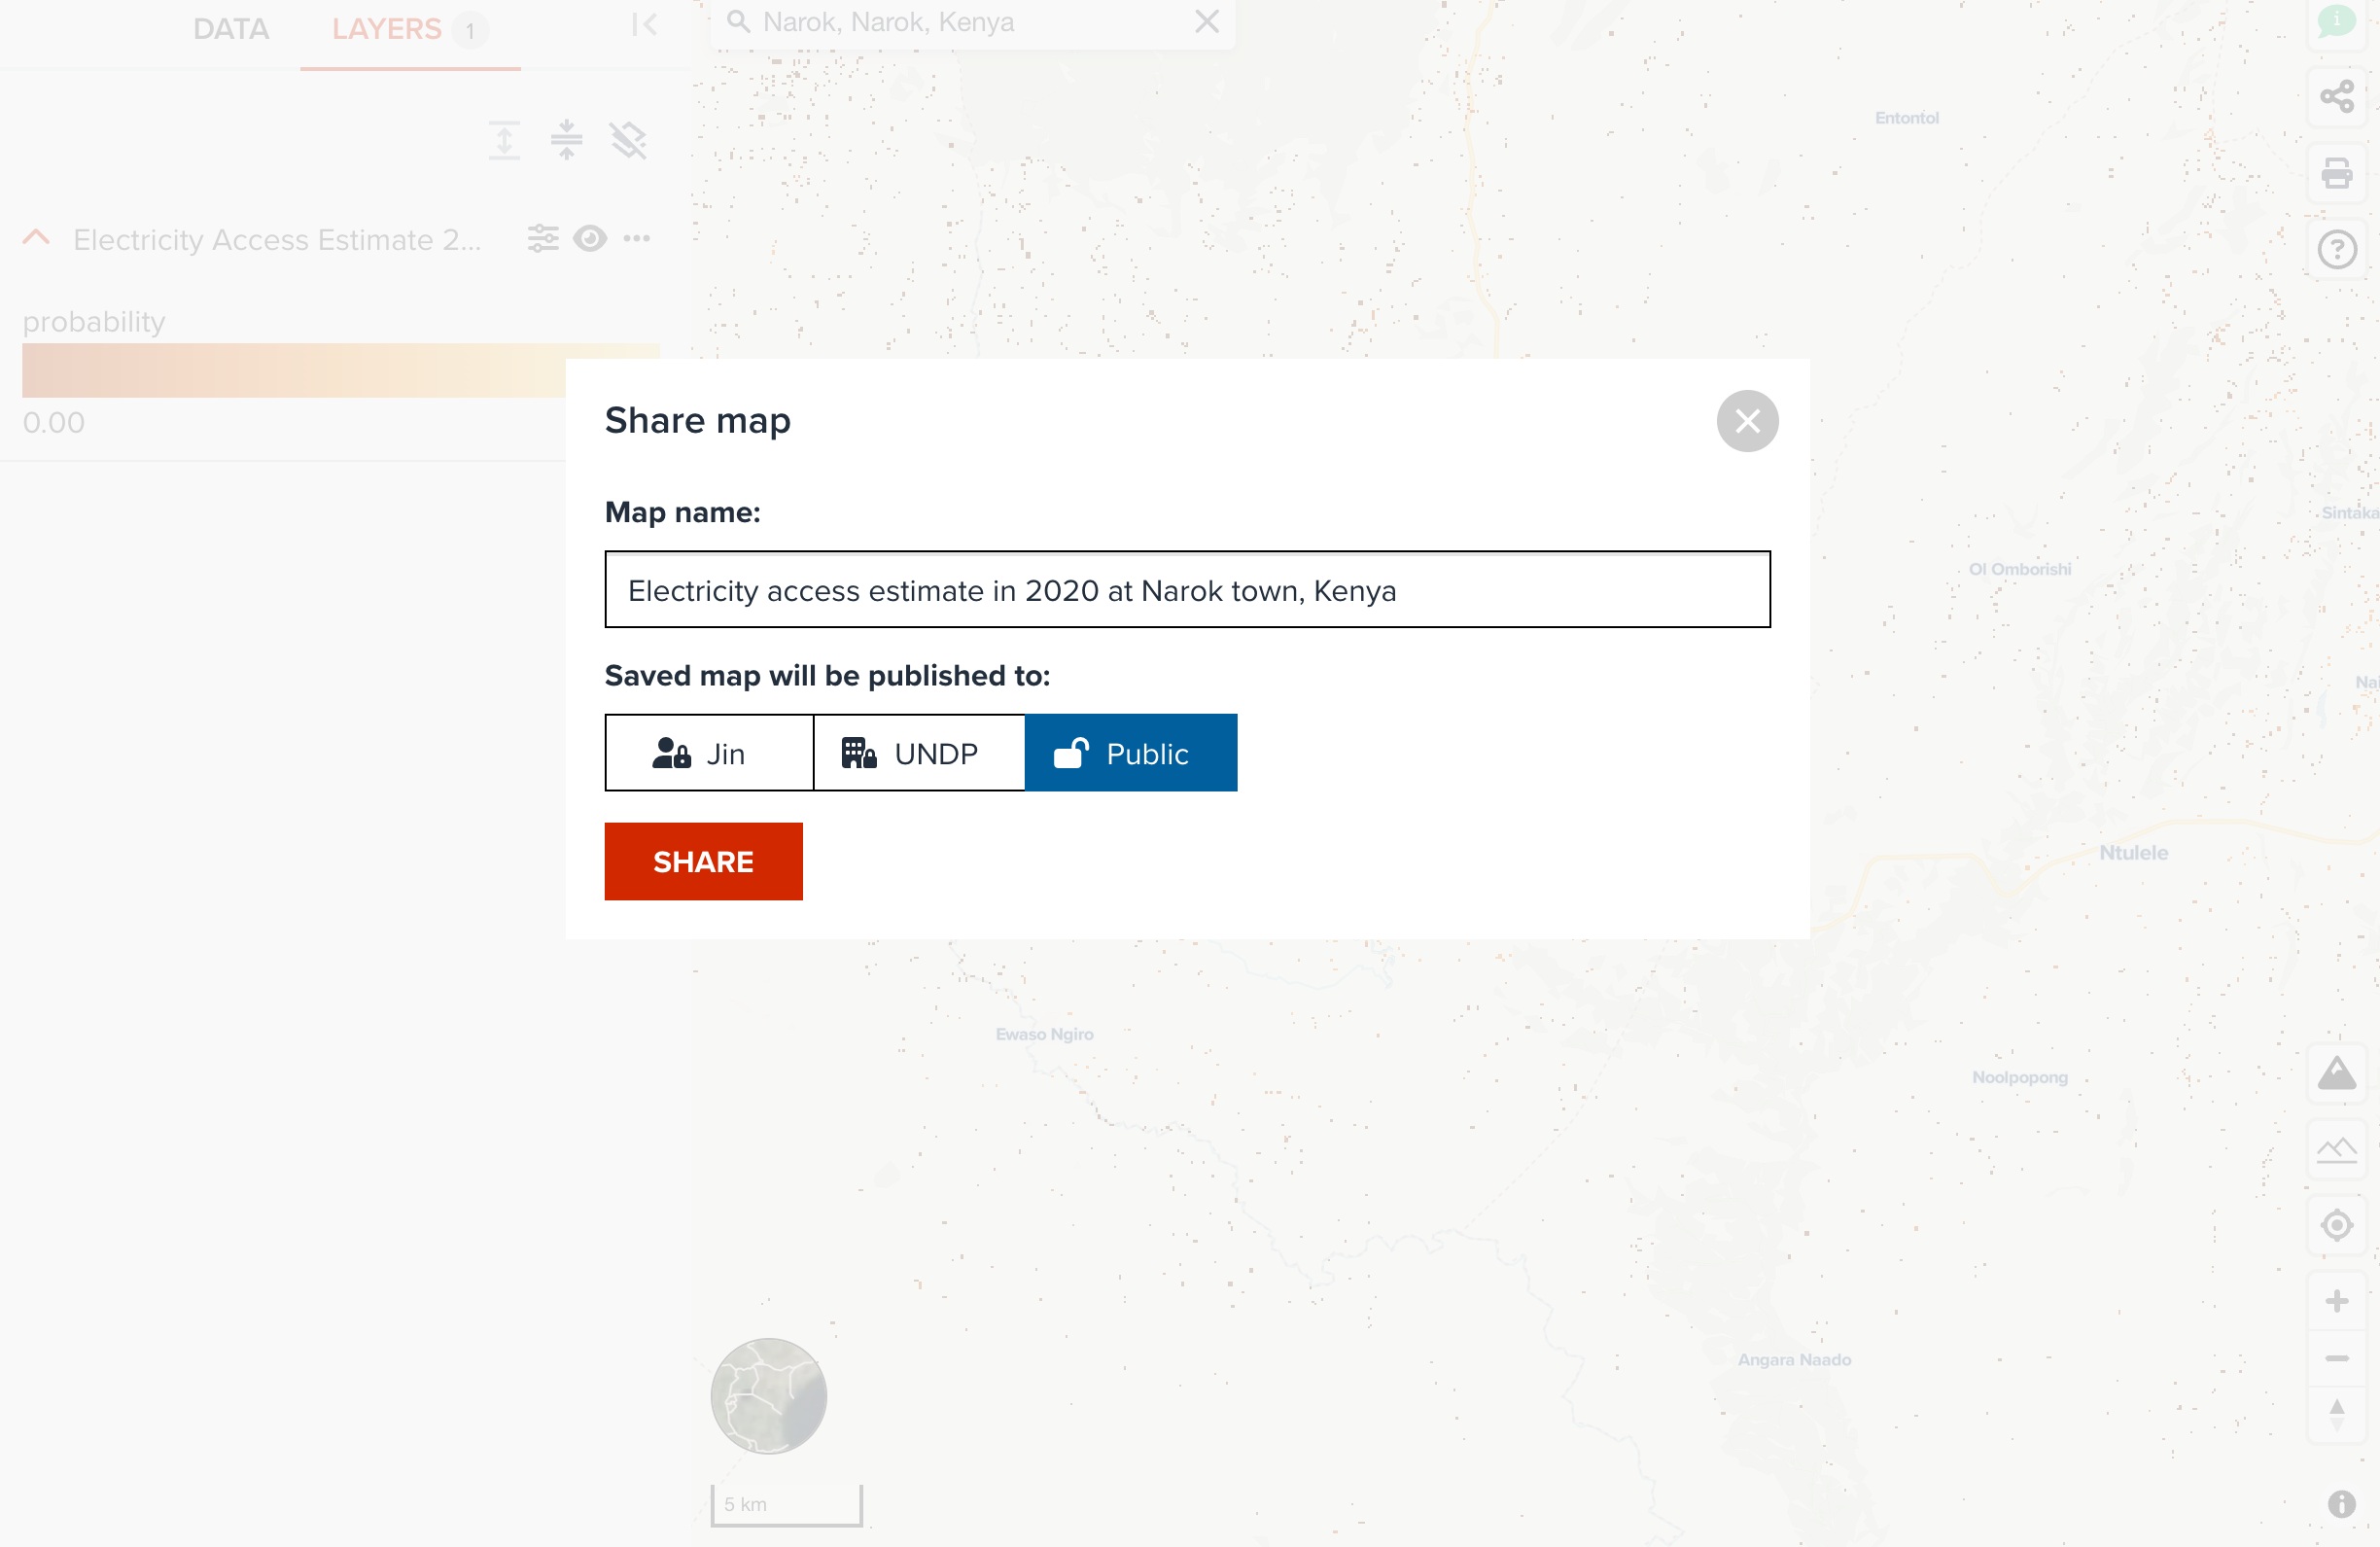
Save a map
Now, we can save a public map. Follow the steps of saving a map, save your map to GeoHub. Rename title to more precise name, and change access level to Public. Then click SAVE button.
--

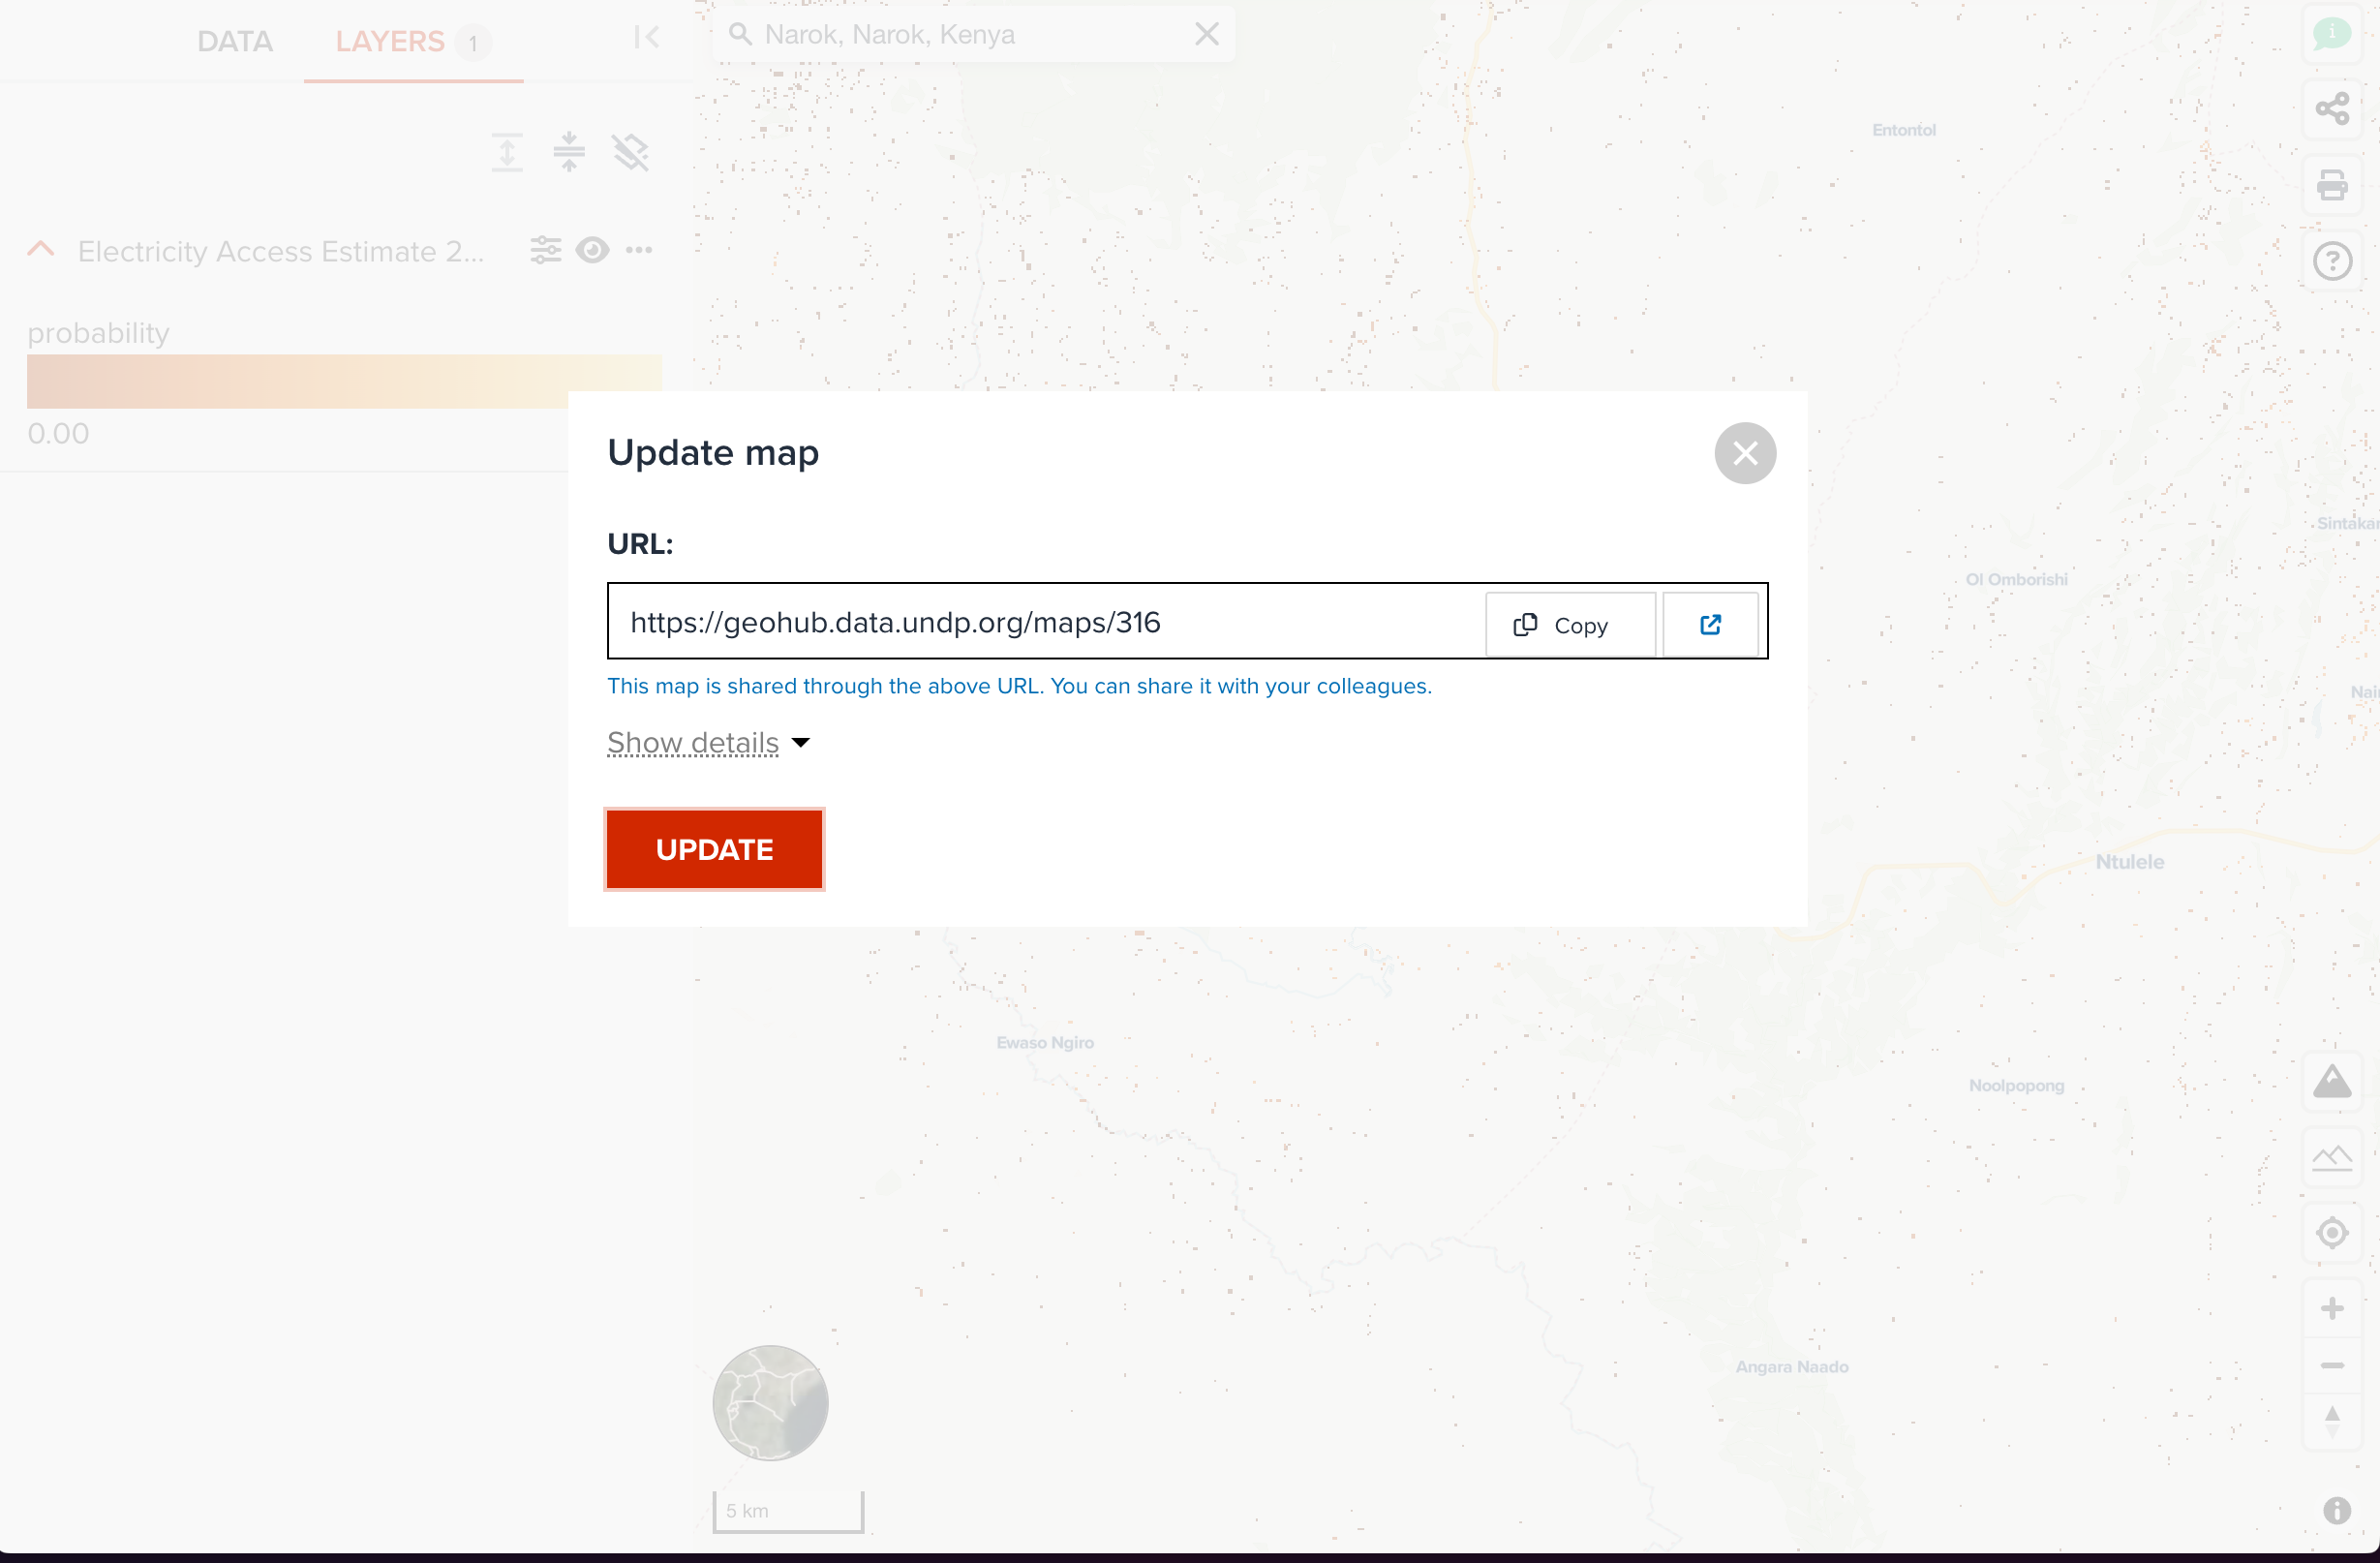
Share a map with other colleagues
Once your map is saved, a unique map URL is shown on the share dialog as shown in the below screenshot.
--
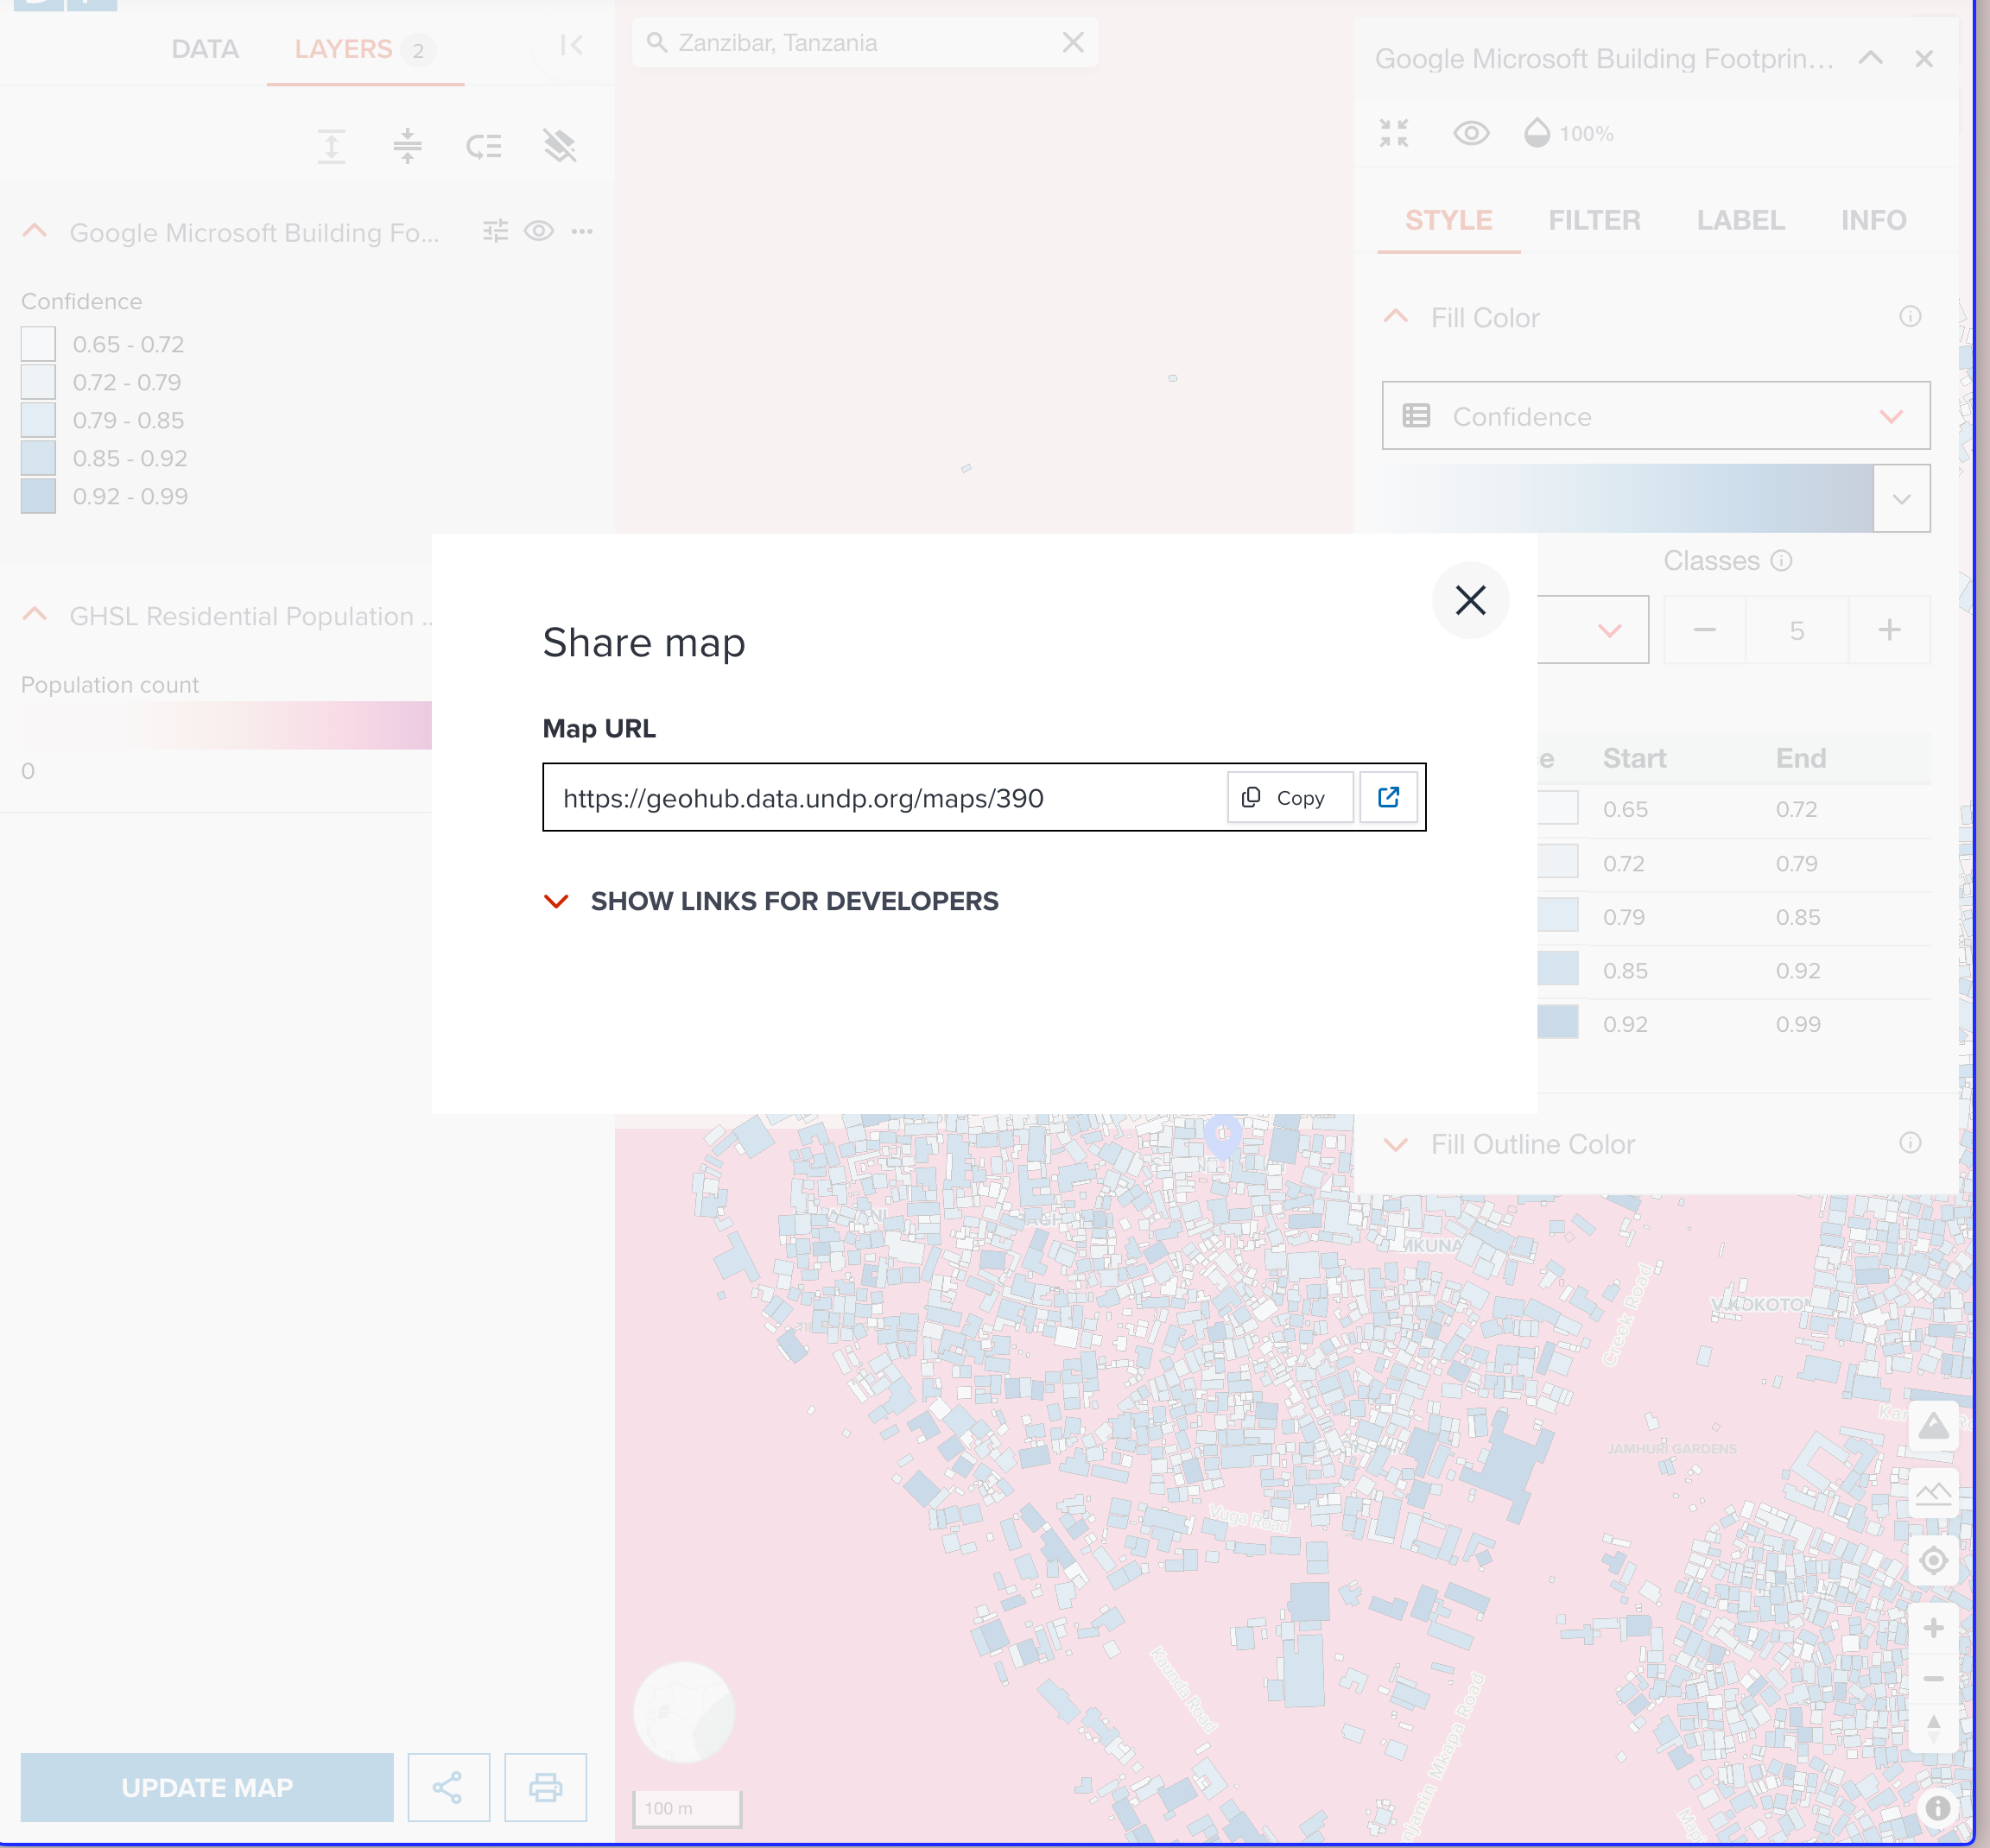
Copy the URL and open it as new tab. Also, share it with one of your colleagues to look at it each other.
Export an image of your map
Alternative to share a URL of map, you can also export a map image from your visualized map by clicking Print button under LAYERS tab.
--
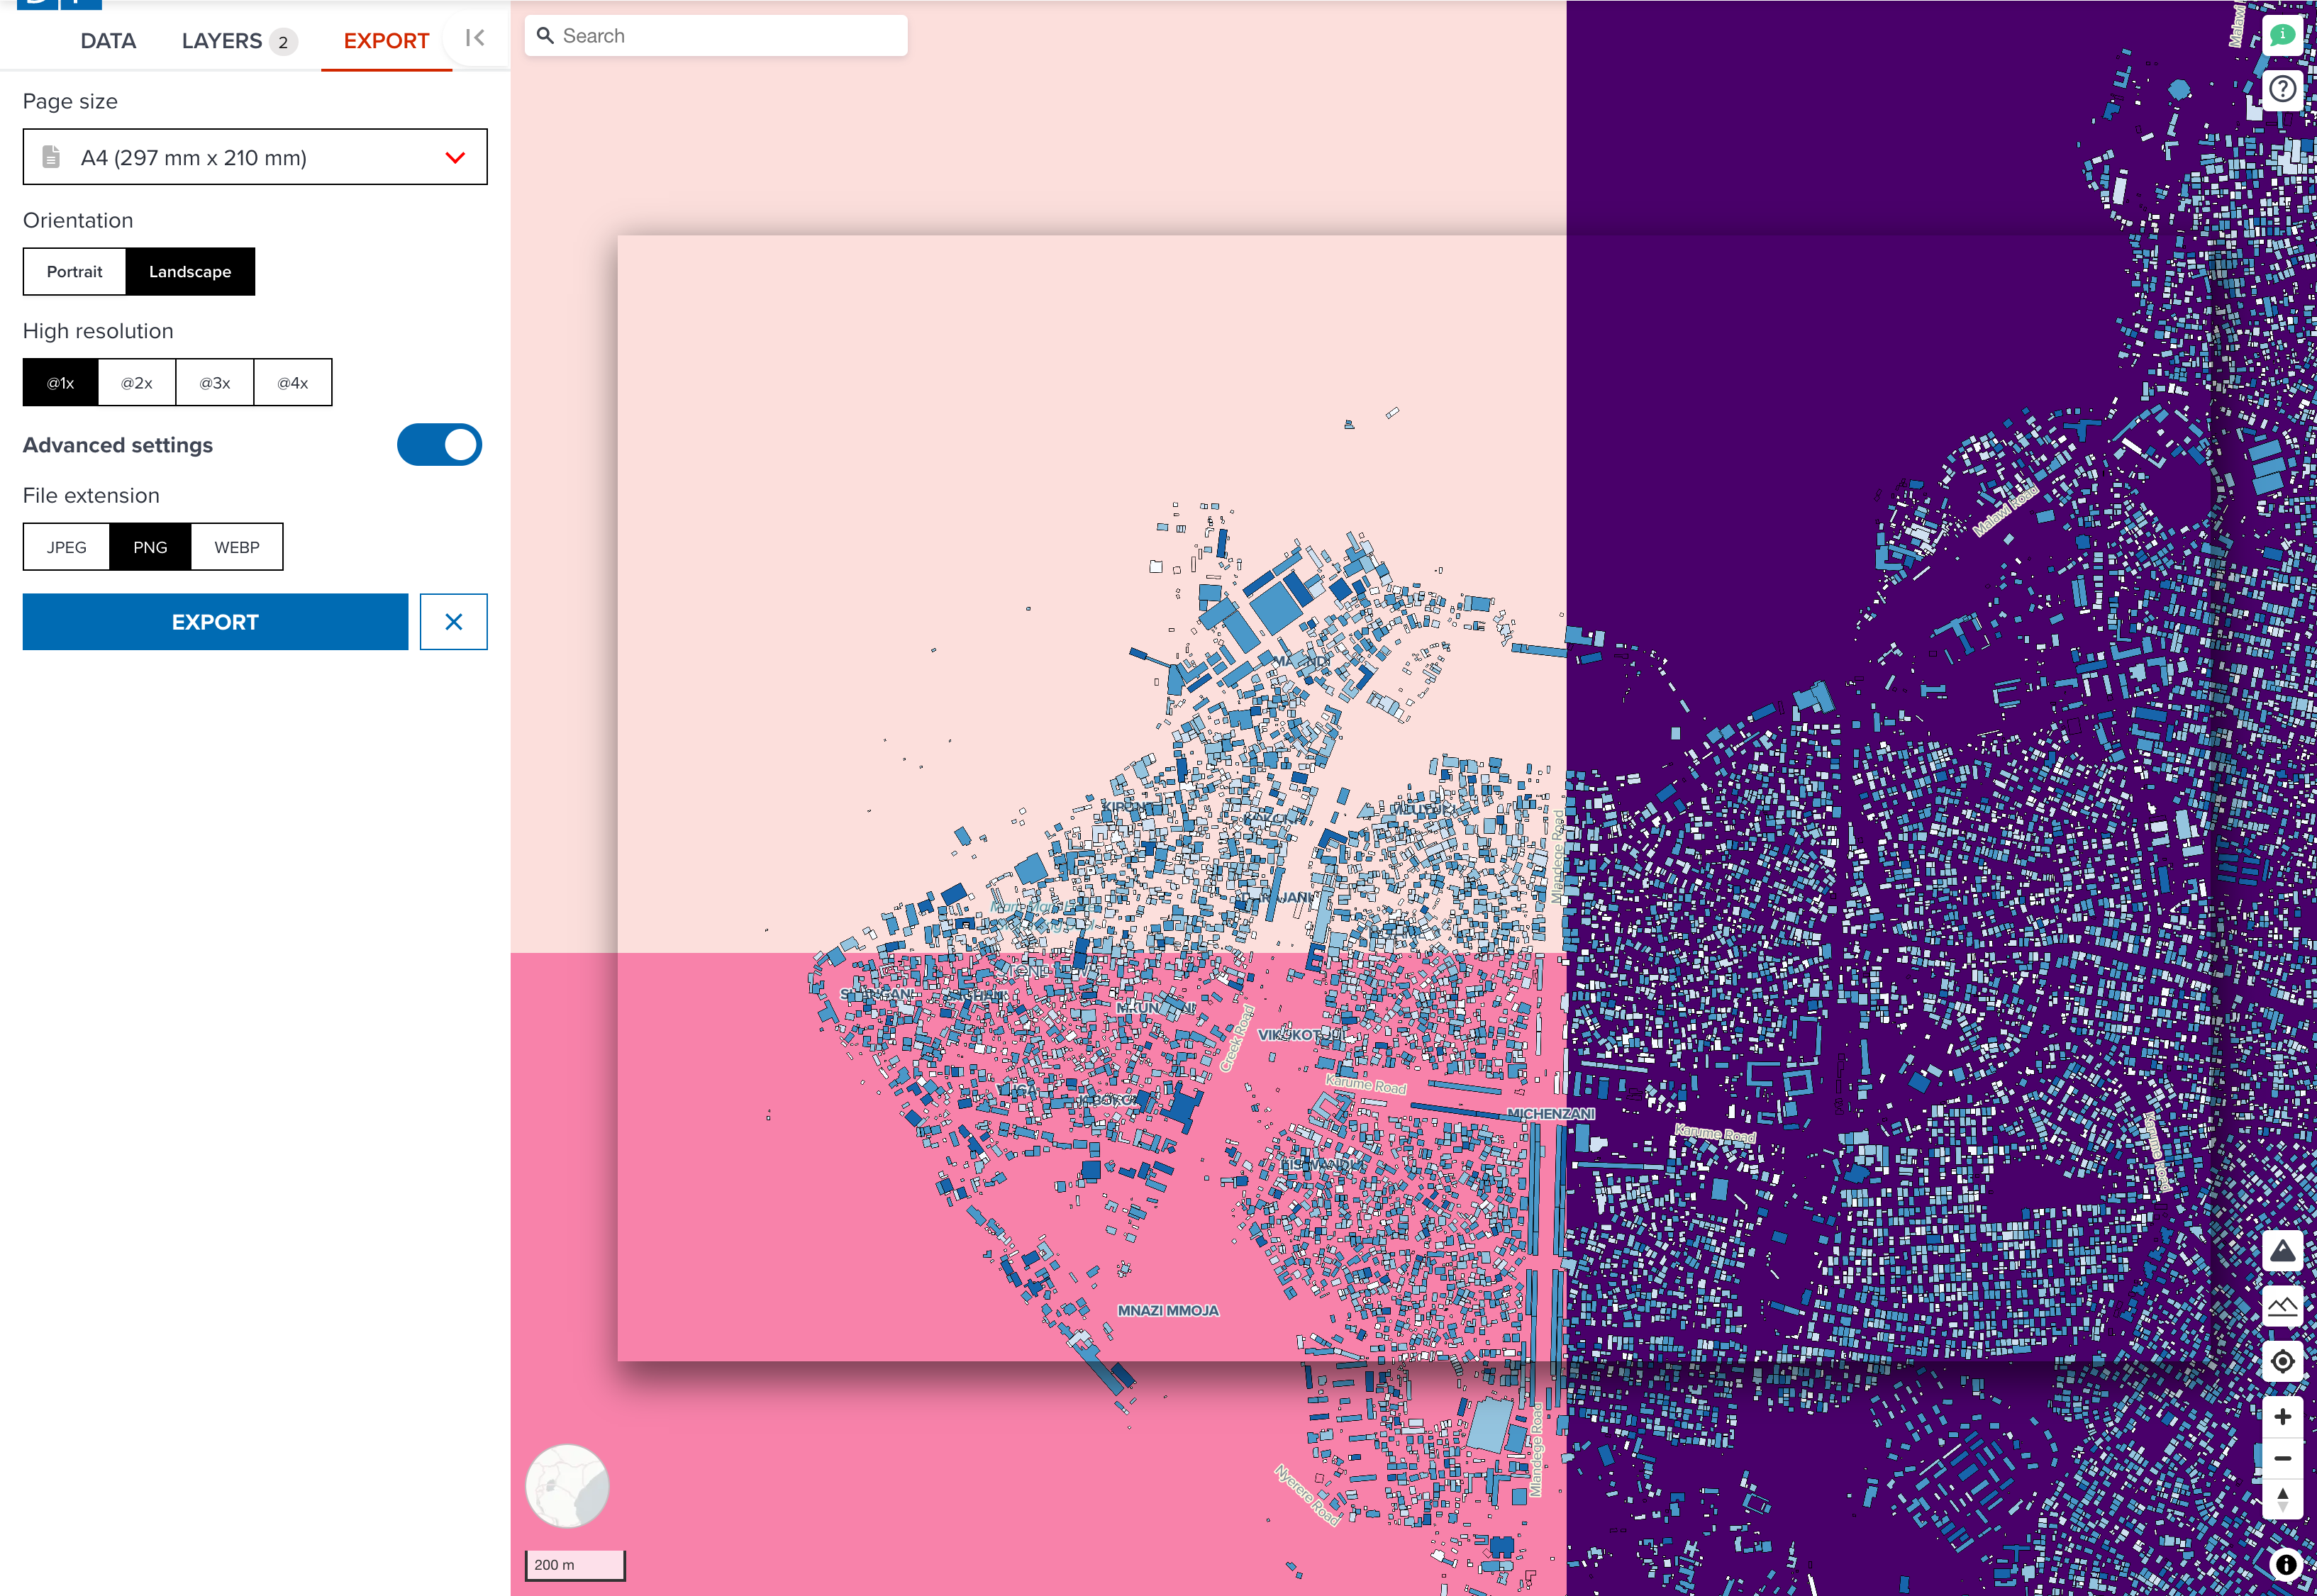
You can change paper size and orientation, and other parameters to export a map image.
Extra challenge
This map now has open buildings vector data over GHSL 2030 population dataset for a particular area of interest. For extra challenge, you can search any other datasets in addition to the data layer we have created.
--
There is a cool dataset called Zanzibar Tourism Attractions. You can try to add this point data to your map. Check Point visualization page about how to visualize a point dataset.