Polygon visualization
--
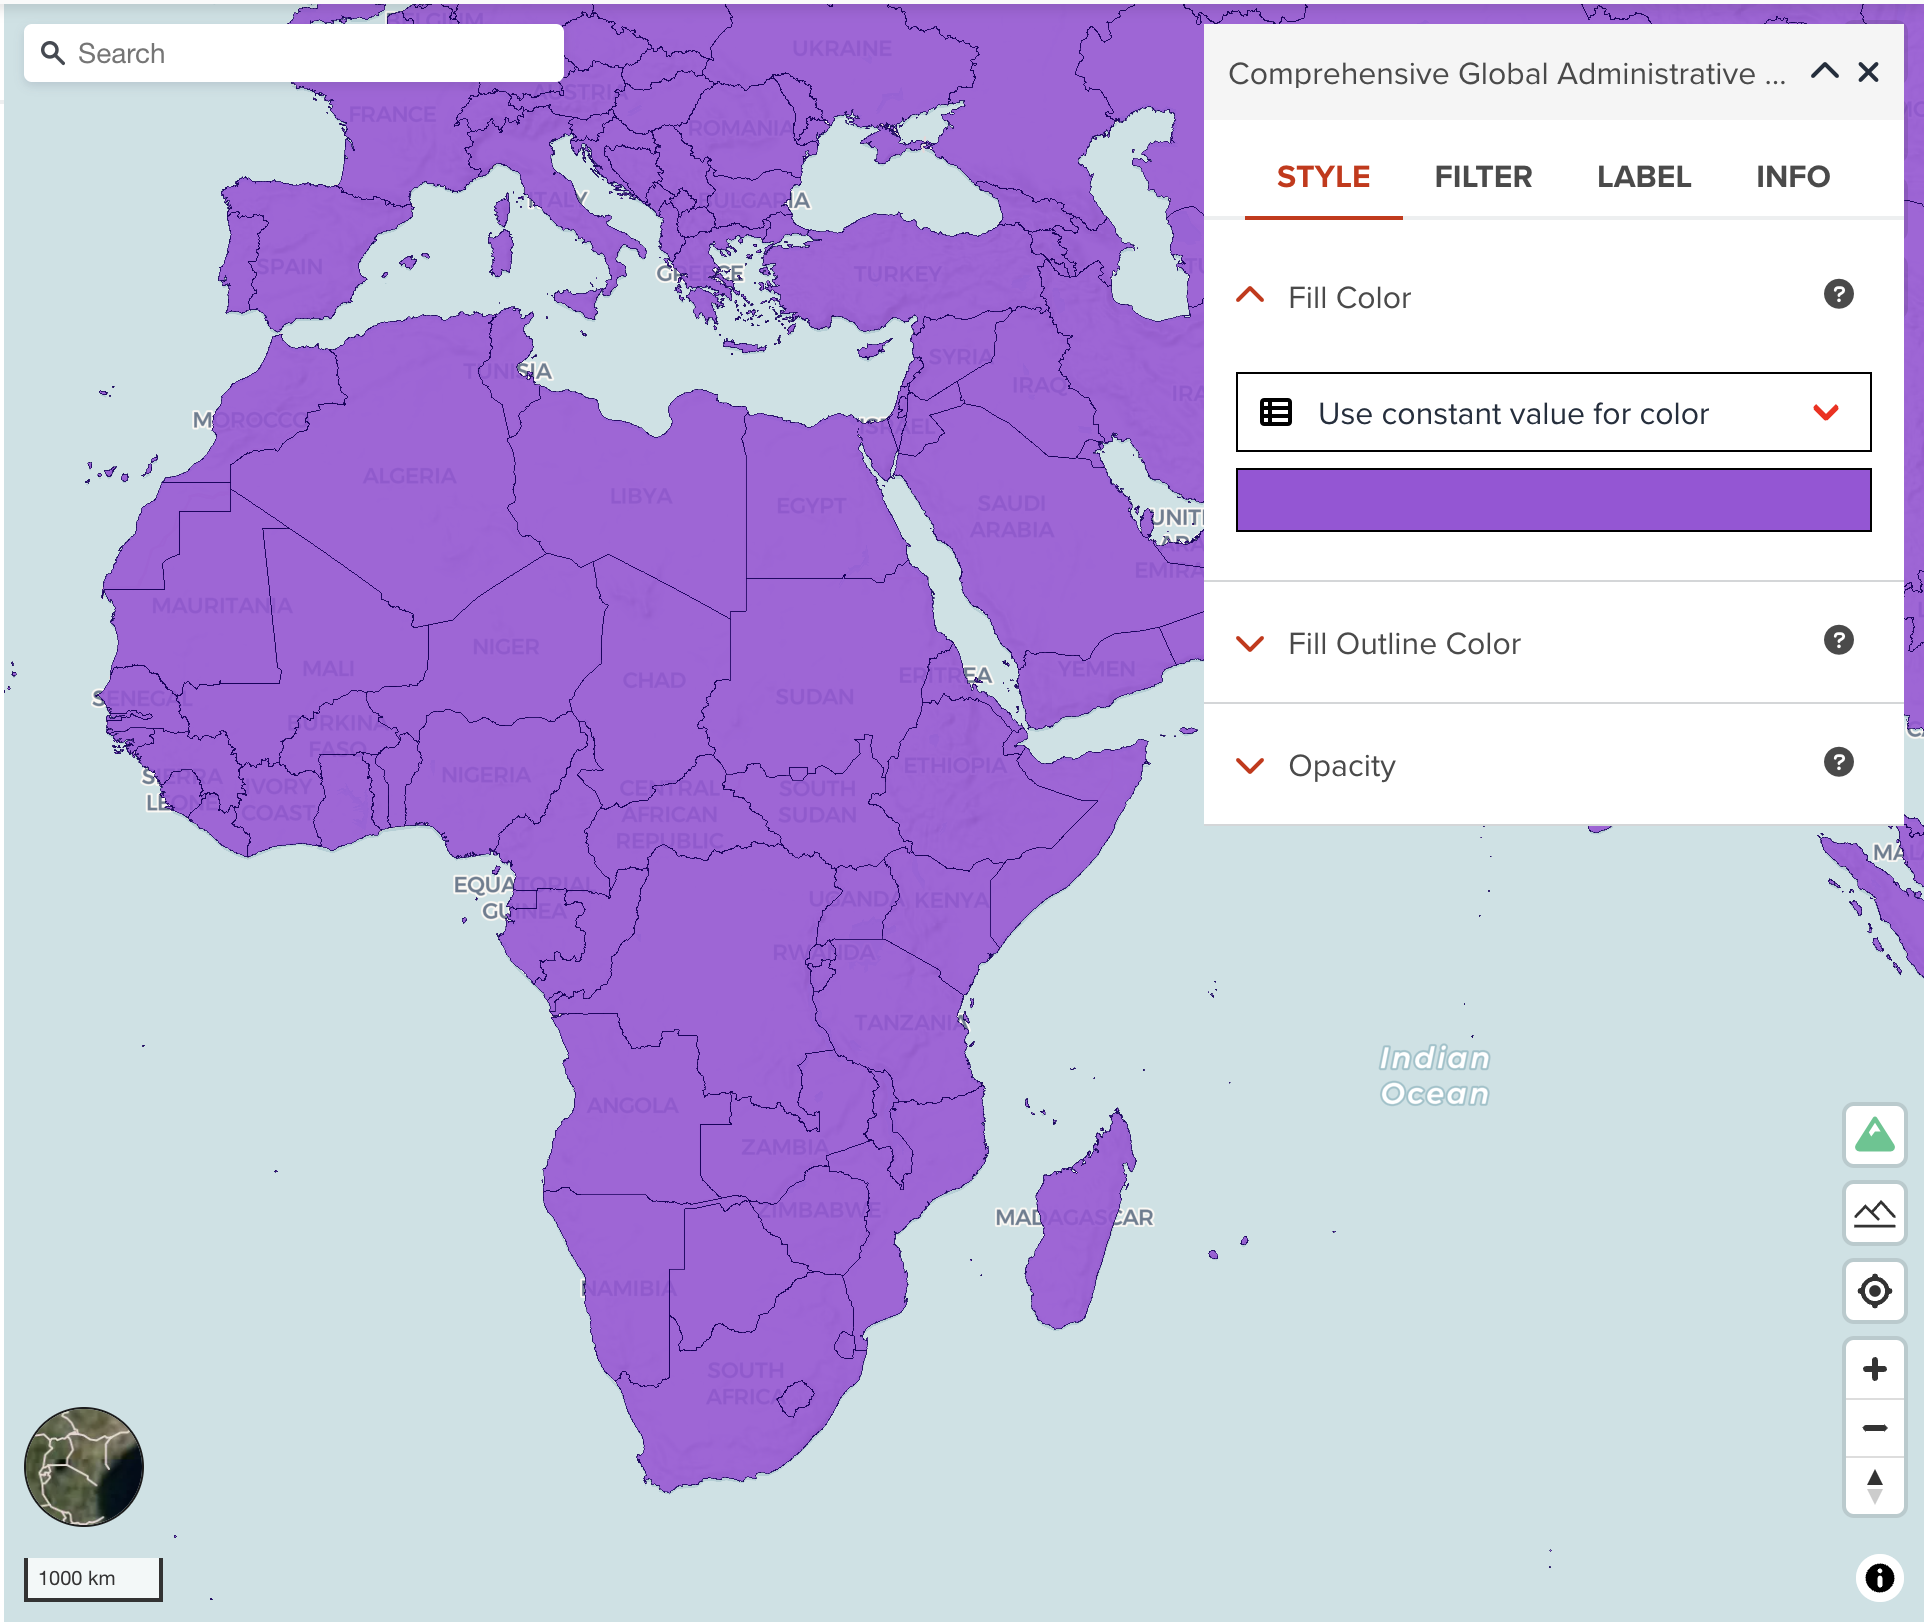
A polygon layer can style the following two properties.
Fill color
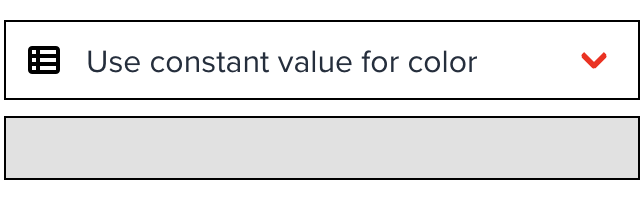
You can choose two ways to set a color to polygons. As default, it uses a constant color which is randomly assigned. This might be useful if you just simply assign a single color to apply for polygon fill color.
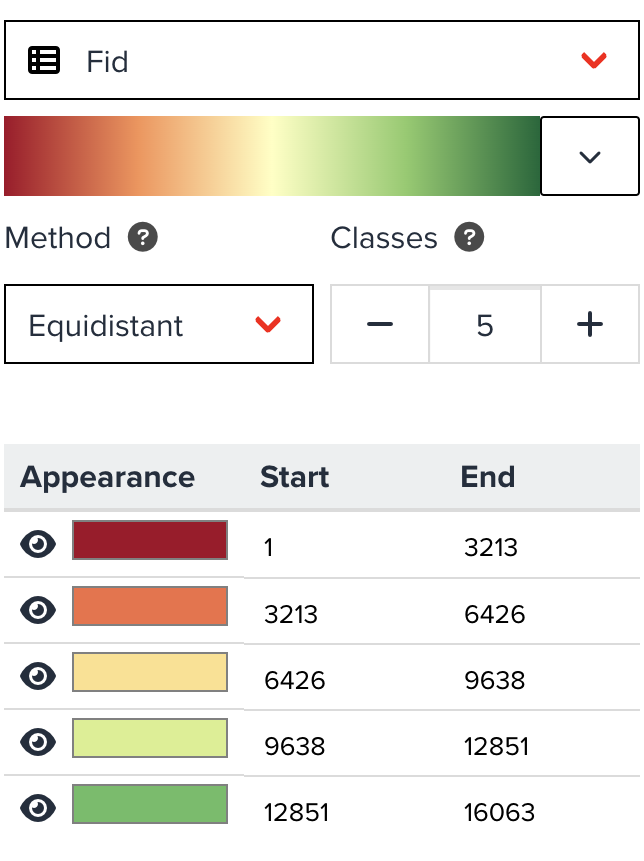
Categorized legend (Numeric property)
--
The figure shows an example when you select a numeric column. Numeric column can be classified by setting interval for each class. You can adjust categorized legend by the following parameters:
- colormap: You can select a colormap from the button. Colormap is available from three types - Sequential, Diverging and Qualitative.
Learn more about colormap here
--
- Method: You can choose a classification method from Equidistant, Quantile, Logarithmic and Natural Breaks.
If the property values are highly skewed, Logarithmic maybe can be selected for better visualization. Equidistant is selected as default. Learn more about classification methods here - Classes: As default, a legend will be created for five classes, however you can decrease or increase the number of classes between two and 25 classes.
Furthermore, you can assign different color per class manually by clicking color button in the table.
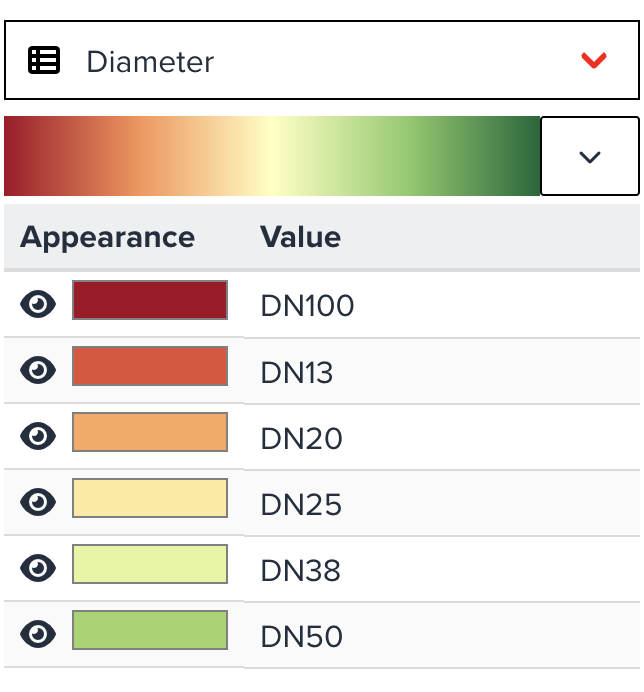
Unique value legend (String property)
The below figure is also for a categorized legend when a string property is selected. This looks like much simpler than interval legend. You only can change a colormap applied for it. The categorized value table will be automatically created.
Fill outline color
You can assign a color for polygon outline. As default, black color will be assigned.
Next step
In the next section, we are going to learn different type of visualization - 3D polygon for polygon dataset