3D Polygon visualization
--
You can adjust the following four properties to visualize 3D polygons. This layer type can be suitable if you want to visualize a layer by using three dimensional.
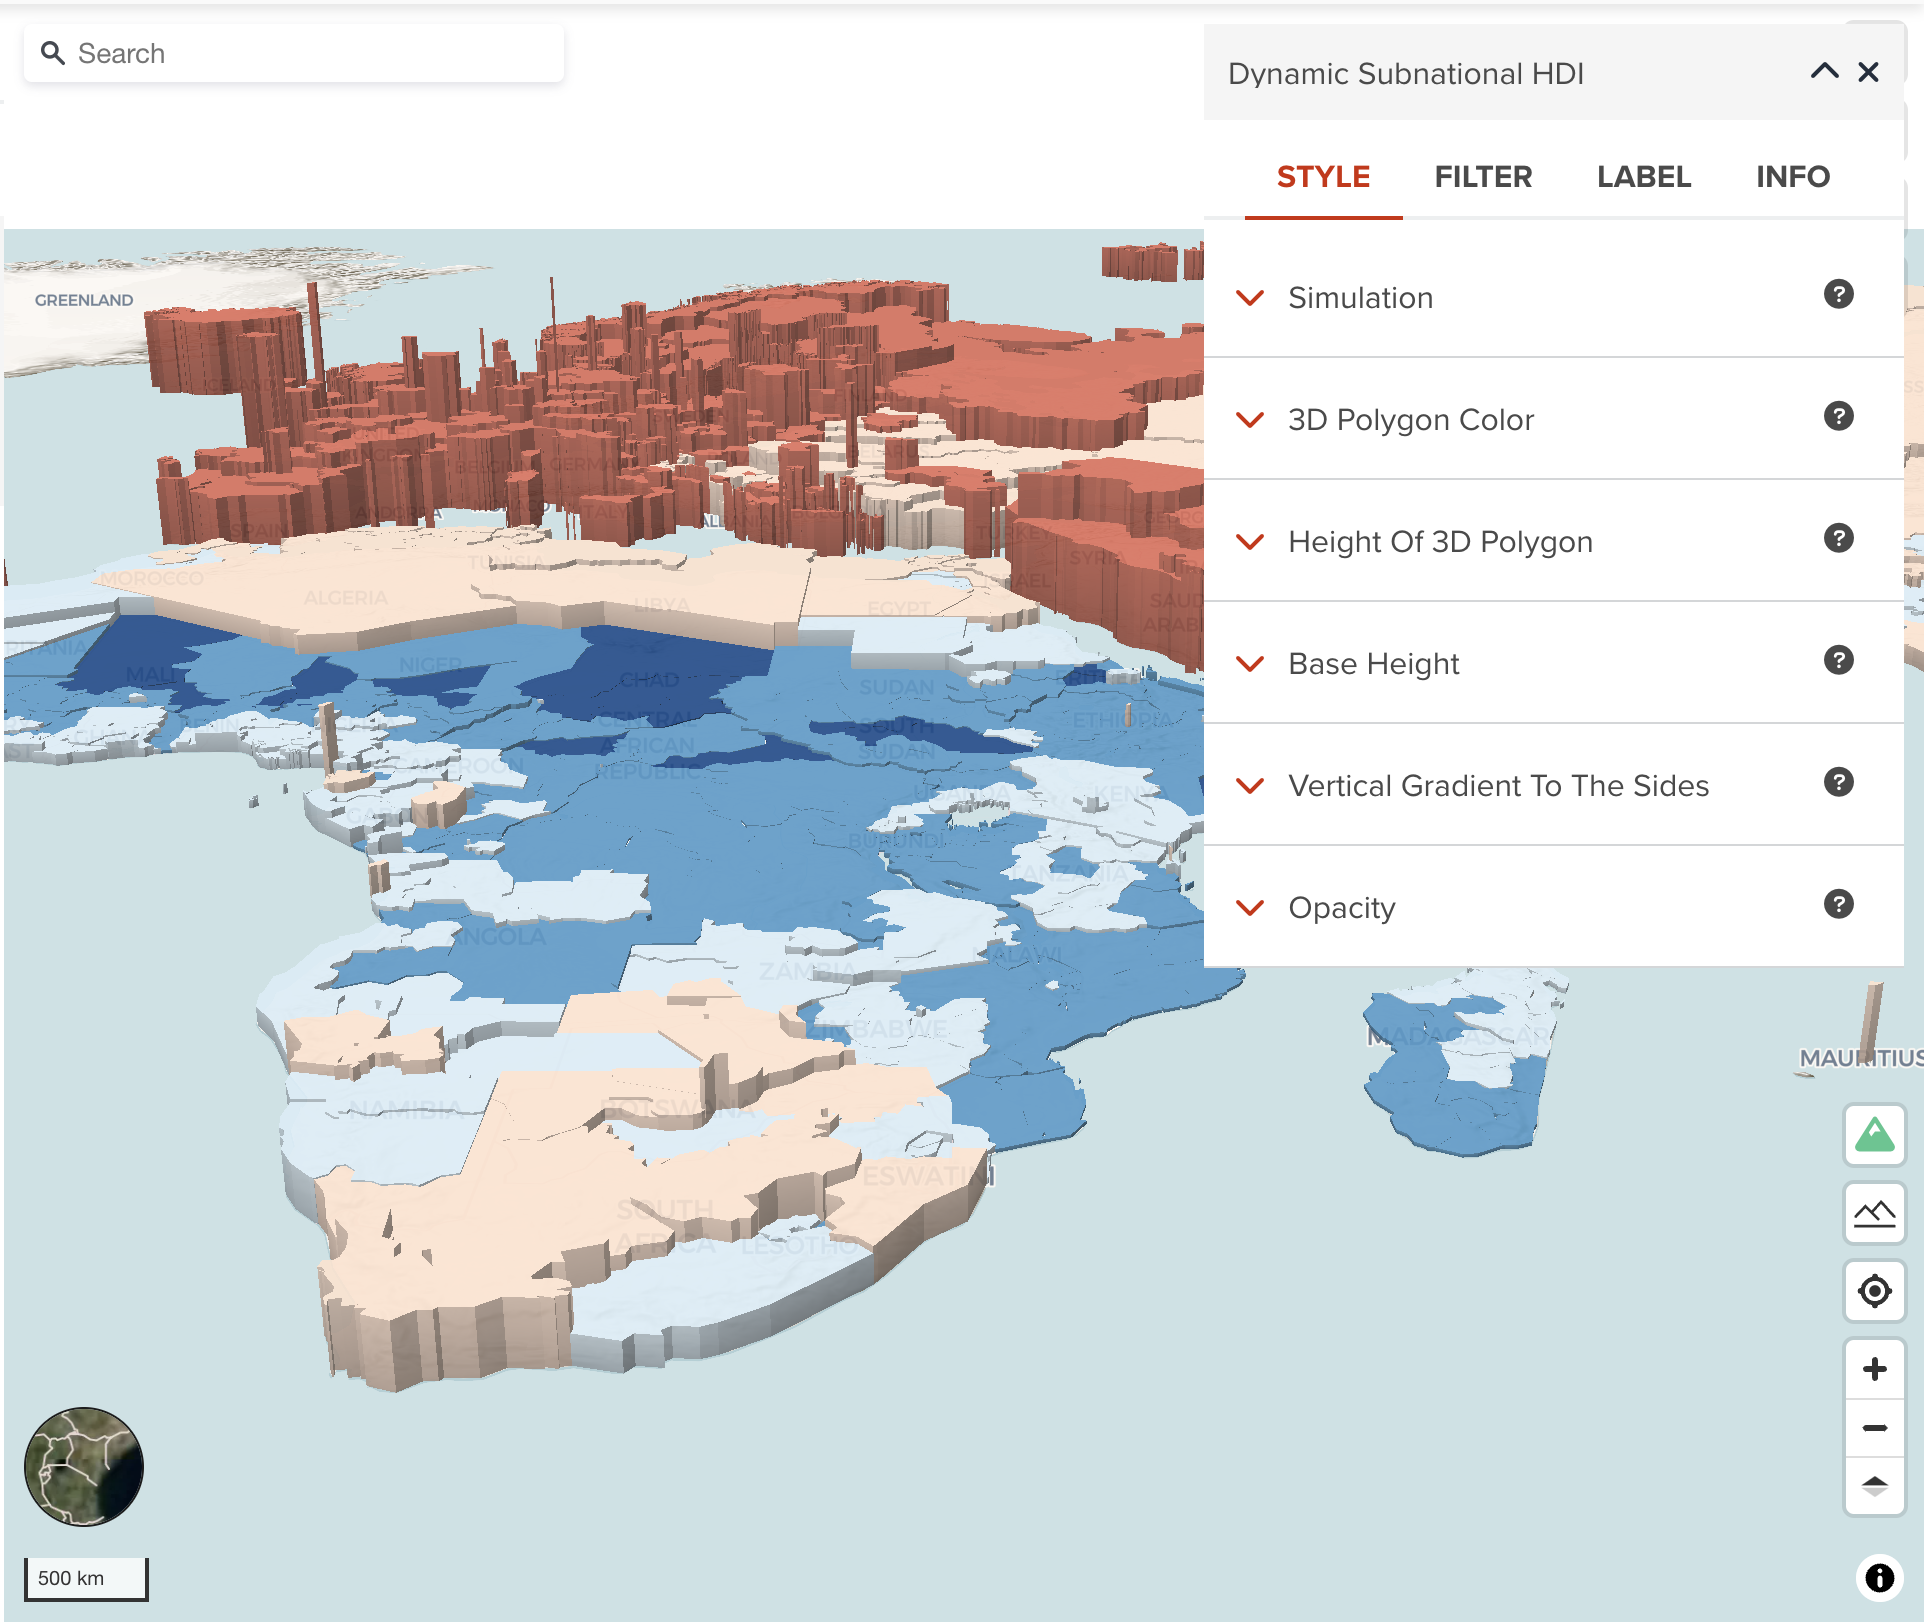
3D Polygon color
You can assign a color or categorized colors for 3D polygon layer. This property can visualize the dataset horizontally (area based).
The color classification component is the same with color visualization of polygon.
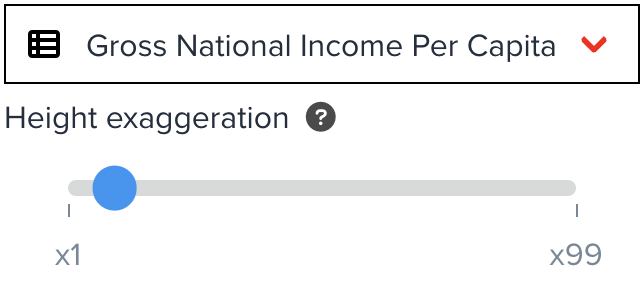
Height of 3D Polygon
Visualizing the height of 3D polygons vertically. You can choose either a constant height value or values from selected property. You only can choose a property from numeric fields.
--
By combining two properties of 3D Polygon color and Height of 3D polygon, you can visualize the data by using two indicators. This can be very powerful visualization for analysis.
Base Height
This is an optional property that you maybe need to ajust. It is the height with which to extrude the base of this layer.
Vertical Gradient to the sides
This is an optional property that you maybe can change it. it is whether to apply a vertical gradient to the sides of a 3D polygon layer. If true, sides will be shaded slightly darker farther down.
Next step
In the next section, we are going to learn visualization for line dataset.