Skip to content

Dynamic vector layers


It is common practive to represent a spatial analytics model or operation using graphs. This has the advantage to increase the clarity and better communicate the core of the analytical model or concept by clearly identifying the inputs, outputs and the internal operations inside the model.

Conceptual graph of a geospatial analytics operation or model
Figure 1: Conceptual graph of a geospatial analytics operation or model


GeoHub goes a step further and allows users to interact with such models in a simple straightforward way just by loading them as layers. Simply said, the models become layers that accept inputs through web interfaces like sliders, text input, etc, and associate this inputs with specific internal parameters of the exposed model.

Dynamic vector layer...

A dynamic vector layeris a type of analytical functionality that encasulates a specific conceptual spatial model implemented through spatial geometrical primitives like polygons, lines and points. It was designed to simplify the user interaction and allow conducting simulations by altering some of its parameters.
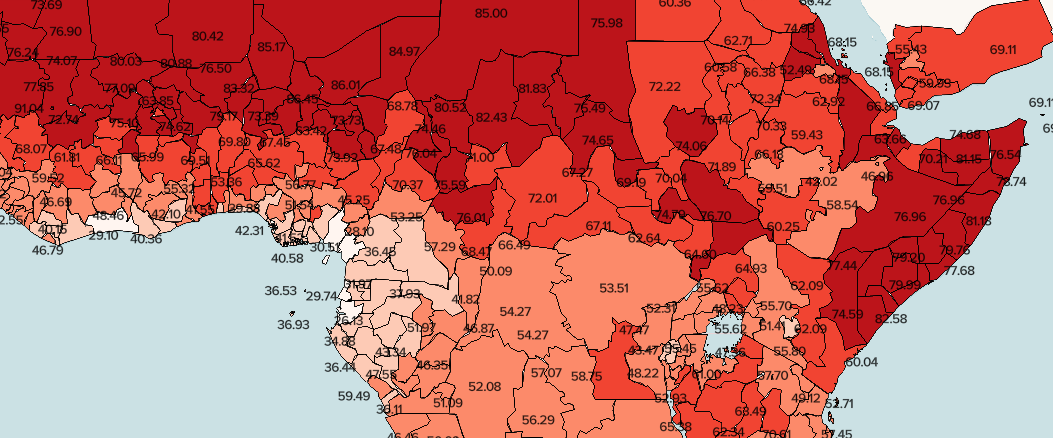

Heat Risk Index

To illustrate the advantage of dynamic layers or analytics as a layer we developed a dynamic Heat Health Risk Index (HHR). Risk indicators are a type of layer that is particulary well suited to be imlemented as a dynamic layer. This is because a risk layer is a composite indicator, with fixed inputs, output and a limited set of control paramerets than control the internal computation. HHR is composed of six variables and each one of the inputs can be controled/adjusted using slider controls. Setting a value for a given parameter results in computing the index for all entities in the layer (admin units) with the input variable adjusted for each end every unit. For example increasing the temperature by 3 degrees Celsius shows the potential risk the population would be exposed if the global temperature would raise by three degrees.


Heat Health Risk indicator structure
Figure 2: Heat Health Risk indicator structure


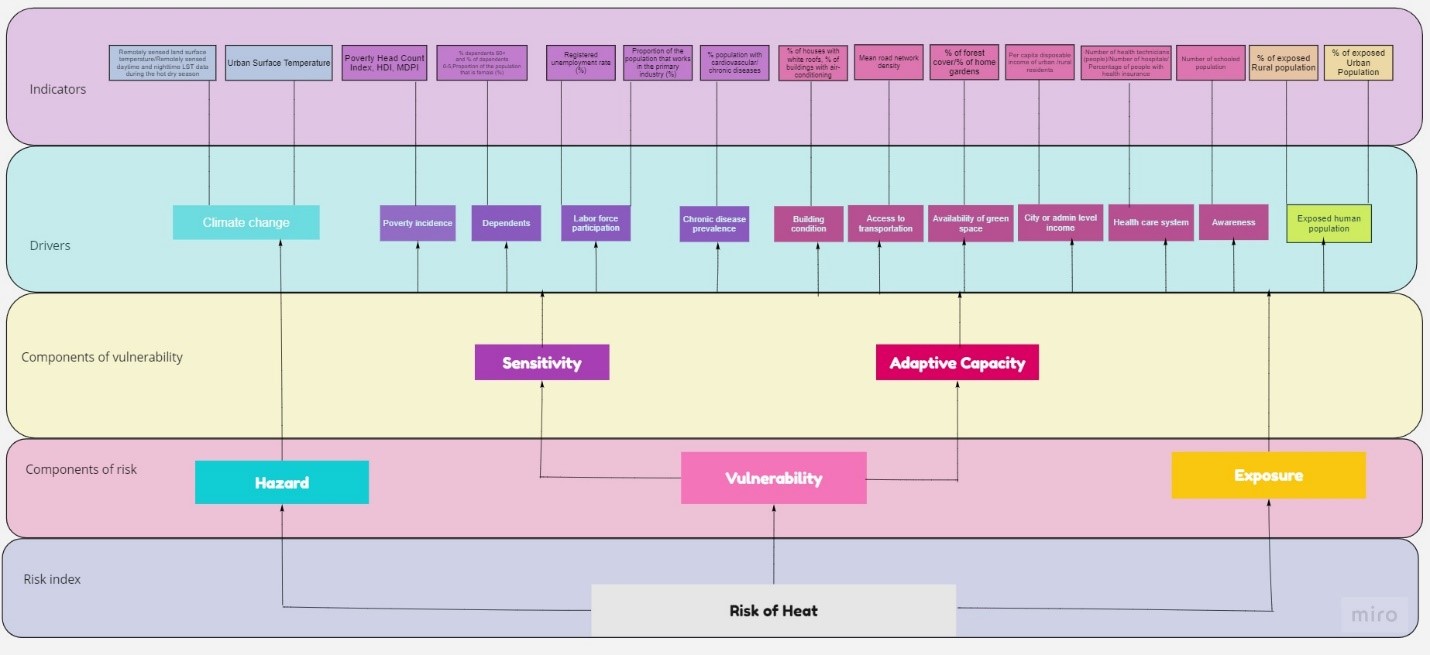
Risk = Hazard X Vulnerability X Exposure
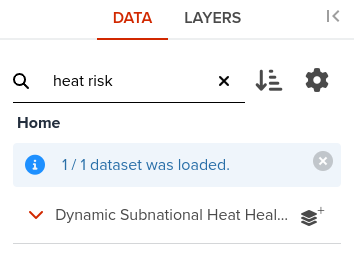
Heat risk UI components in GeoHub
Figure 3: Heat risk UI components in GeoHub

1. Create a new map

Open GeoHub and create a new map
Figure 4: Open GeoHub and create a new map

2. Load dynamic layer

Find and load **Dynamic Subnational Heat Health Risk**
Figure 5: Find and load **Dynamic Subnational Heat Health Risk**

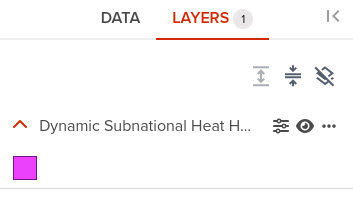
3. Open layer properties

Open layer Properties
Figure 6: Open layer Properties

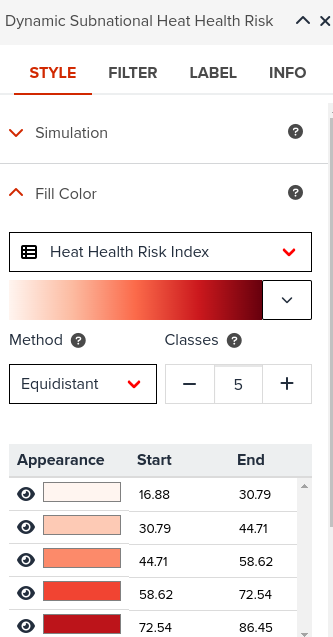
4. Alter layer symbology

Create a choropleth map by changing the visualization STYLE->Fill Color
Figure 7: Create a choropleth map by changing the visualization STYLE->Fill Color

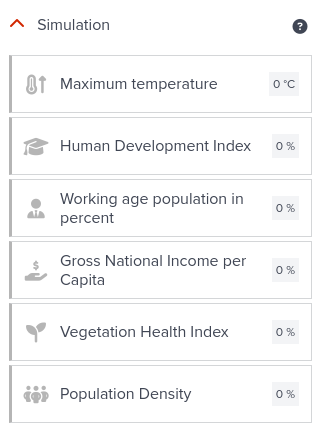
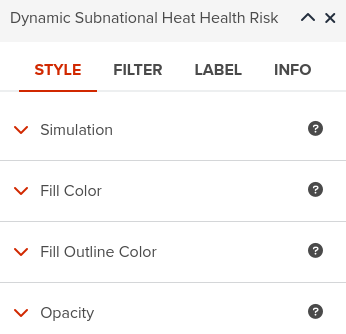
5. Open simulation parameteres

Open and set the parameters of the layer by clicking on **Simulation**
Figure 8: Open and set the parameters of the layer by clicking on **Simulation**

6. Adjust simulation parameteres
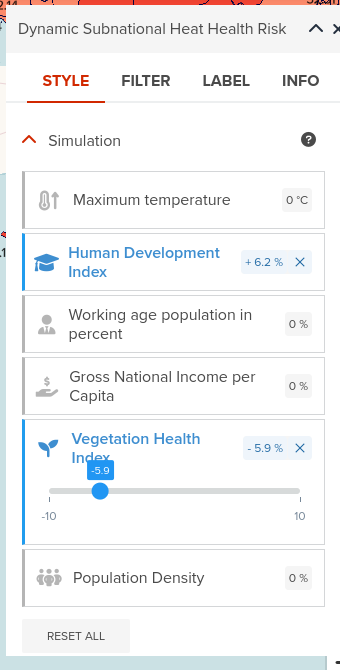
Adjust one or more parameters and observe the changes in colors or various administrative units
Figure 9: Adjust one or more parameters and observe the changes in colors or various administrative units

Tip

By moving the sliders allocated to parameters you are passing those values to the server side where the new values of the risk are recomputed in real time. Note that in the picture above the Human Development Index and Vegetation Health Index parameters have been changed as they are maked with blue color.
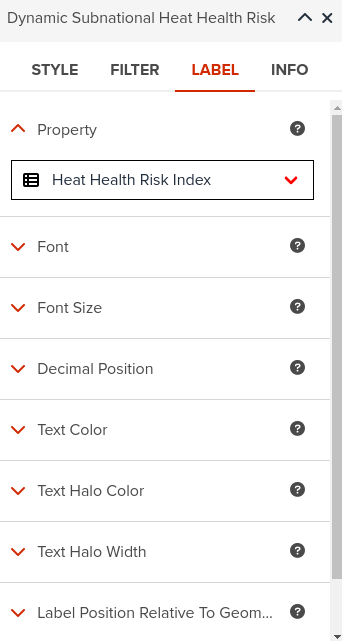
7. Label the layer

Tip

It is a good idea to label the features. This helps observing the effect of a given parameter on the layer/model. In Layer Properties go to LABEL tab and select the attribute Heat Health Risk Index. Optionally increase the number of digits or precision by clicking on Decimal position

Label tab for dynamic vector layer
Figure 10: Label tab for dynamic vector layer

As a result, the HHR dynamic layer can be used to identify the risks to the population and develop specific climate adaption strategies to reduce heat-related health risks.

The Dynamic Subnational Heath Health Risk Index map over Central Africa
Figure 11: The Dynamic Subnational Heath Health Risk Index map over Central Africa