Skip to content

Imagery based analytics


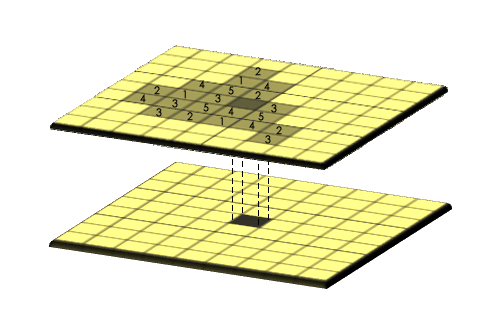
Raster analysis is the process of analyzing spatial information contained in grid datasets. Each cell in a grid contains a value or class, which could be related to soils, land cover, elevation, or another type of data.

Raster or gridded analysis

GeoHub is powered by titiler a custom Cloud Optimized Geotiff(COG) server that converts on the fly COGs to map tiles in graphic formats. Titiler features sophisticated mechanisms that can be employed to transform the input COG files on the server side. This forms the backbone of raster based analytics. In practice, all these details are hidden under the concepts of algorithms and expressions through the UI/UX components.


Much like dynamic vector layers, specific algorithms can be applied transparently to raster layers represented by individual COGs, MosaicJSON documents or Spatio Temporal Assets Catalogs(STAC) assets.


Raster tiles


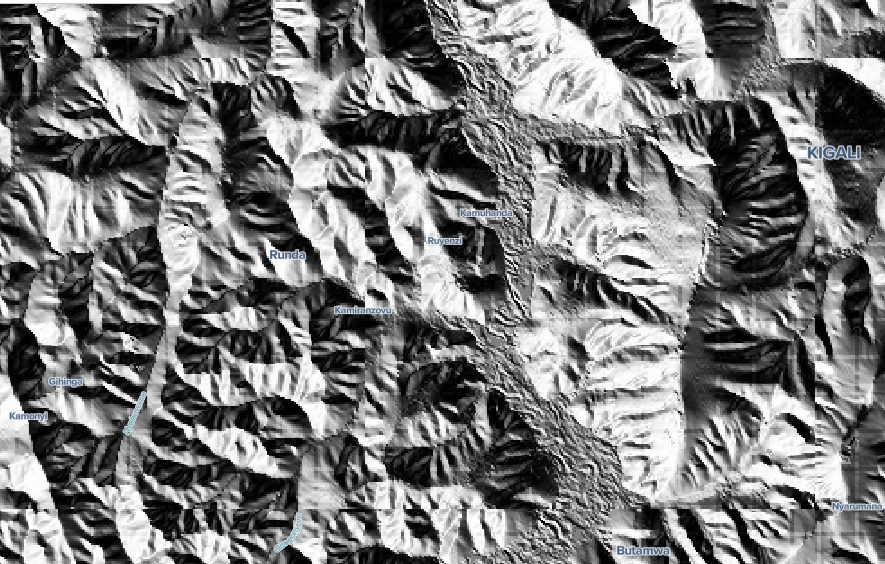
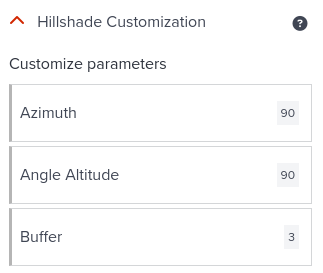
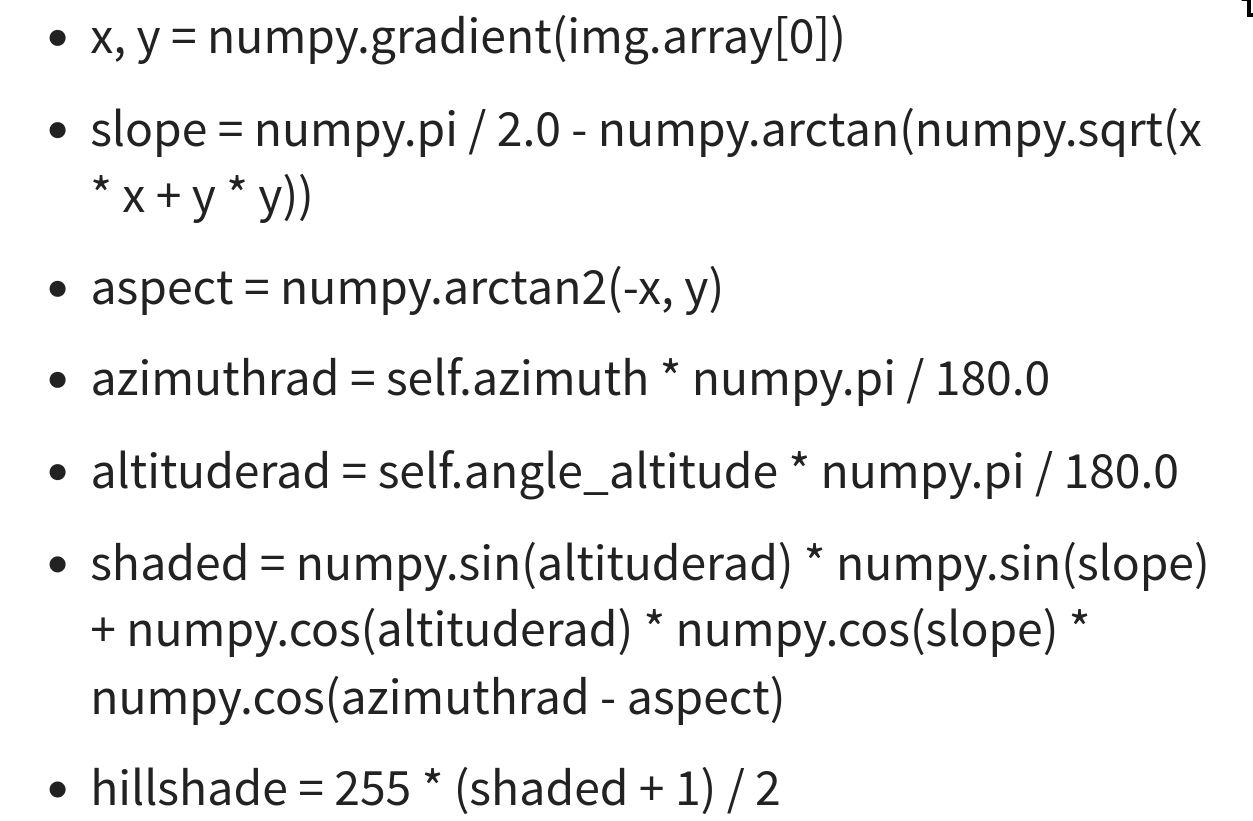
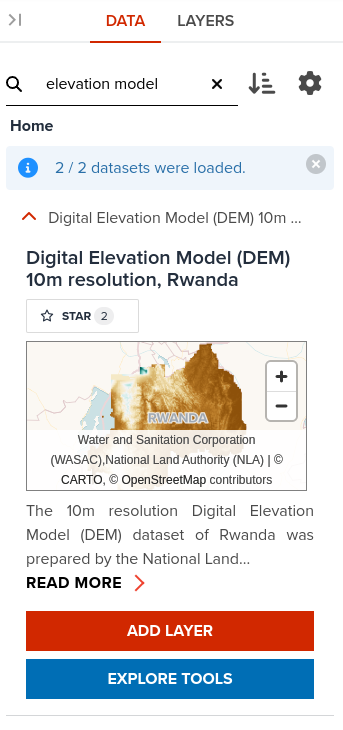
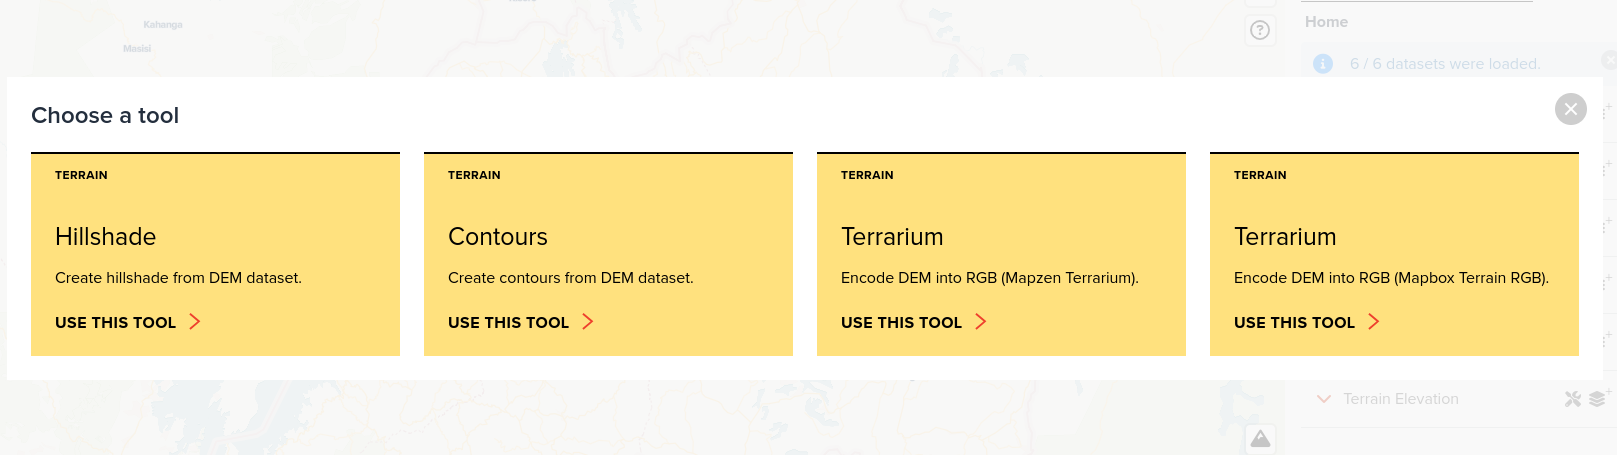
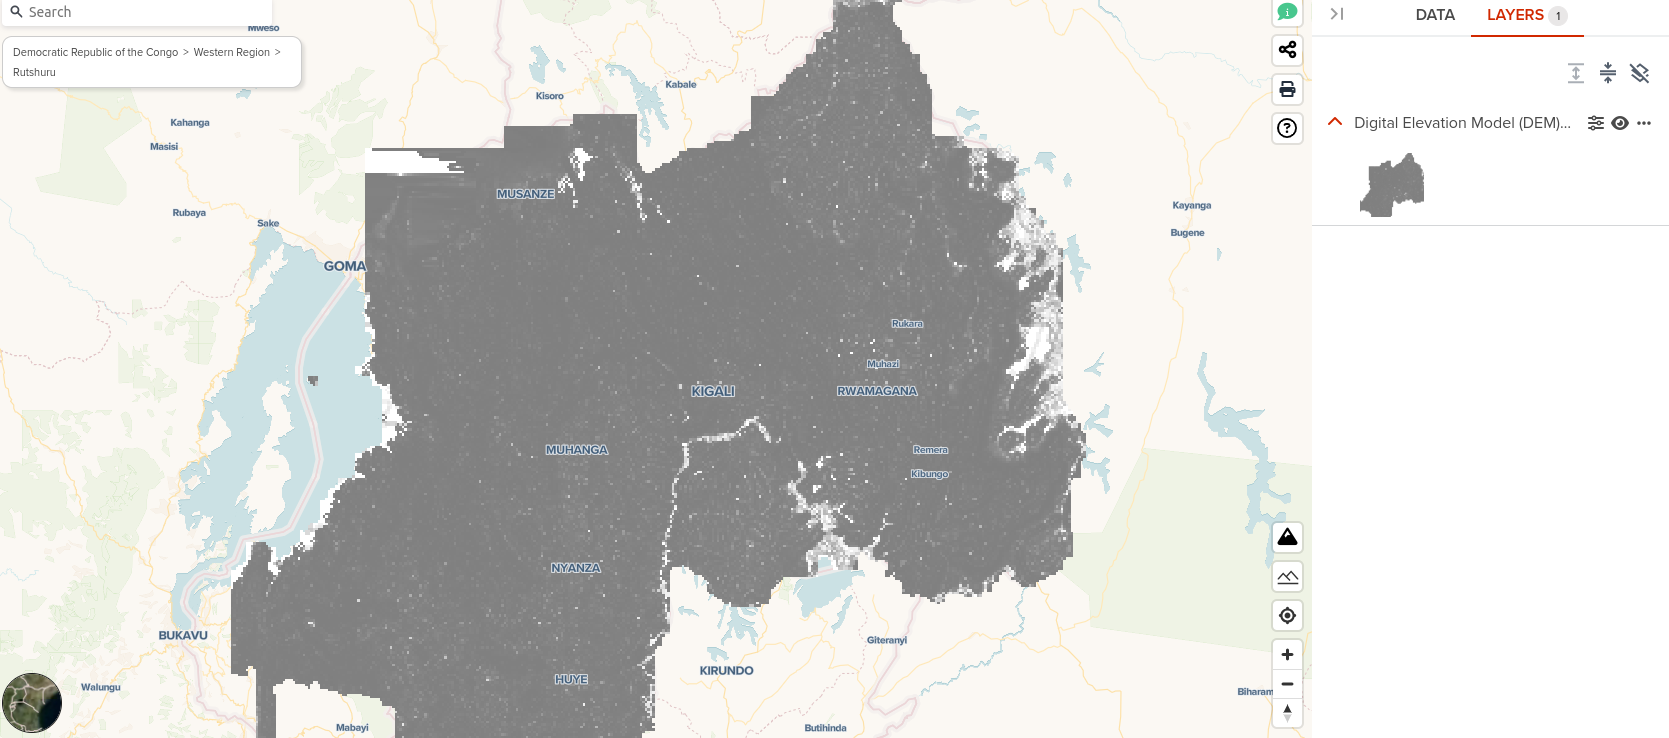
We shall illustrate in the lines below how can one apply simple analytics to specific raster layers. We are going to create a hillshade layer 
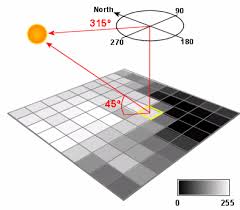
from elevation data. Hillshade or shaded relief shows the shape of the terrain in a realistic fashion by showing how the three-dimensional surface would be illuminated from a point light source.

Hillshade visiualization after adjusting parameters
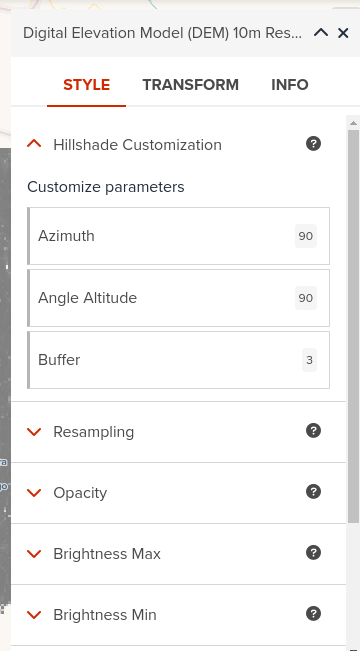
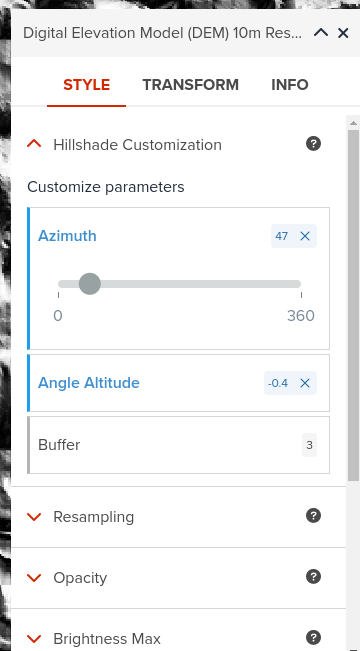
Figure 1: Hillshade visiualization after adjusting parameters


Terrain hillshade algorithm Terrain hillshade parameters


Hillshade algorithm in python

1. Open GeoHub and create a new map

Open new map
Figure 2: Open new map

--

2. Search elevation

Search elevation data by typing elevation model in DATA tab
Figure 3: Search elevation data by typing elevation model in DATA tab

--

3. Select the hillshade algorithm

Select the hillshade algorithm
Figure 4: Select the hillshade algorithm

--

Load elevation data  with hillshade algorithm applied
Figure 5: Load elevation data with hillshade algorithm applied

--

4. Open layer Properties dialog

Open layer Properties dialog
Figure 6: Open layer Properties dialog

--

5. Adjust hillshade Azimuth partameter to 45 and Angle Altitude to 0

Adjust hillshade Azimuth partameter to 45
Figure 7: Adjust hillshade Azimuth partameter to 45

--

Hillshade visiualization after adjusting parameters
Figure 8: Hillshade visiualization after adjusting parameters


This example aimed to demonstrate how GeoHub employes and presents the concept of raster based analytics. The code idea is to:

  • create algorithms
  • tag targeted datasets with the algorithm name
  • execute and interact with the algorithm